

Orchestrating AI Driven Automated Software Testing Workflows
To download this as a free PDF eBook and explore many others, please visit the AugVation webstore:
Introduction
Defining the Challenge of Modern Software Testing
Enterprise applications today span microservices, distributed systems, mobile platforms, APIs, and edge devices, all under stringent regulatory and security demands. Manual testing processes have become a bottleneck, unable to keep pace with rapid code commits, continuous integration and delivery pipelines, and dynamic cloud-native environments. To compete, organizations must accelerate test throughput without sacrificing functional and non-functional quality metrics.
Key factors driving this need include:
- Proliferation of Deployment Targets across public cloud, private data centers, mobile devices, and IoT endpoints, each requiring tailored test configurations.
- Increased Release Frequency with CI/CD pipelines triggering builds and deployments dozens or hundreds of times per day.
- Regulatory and Security Constraints demanding rigorous data handling, audit trails, and integrated security testing.
- Distributed System Observability requiring end-to-end coverage to detect performance degradations or integration faults.
- Parallel Development Streams—feature branching, pull requests, and hotfix workflows—that overwhelm manual capacities.
Accelerating test throughput in this complex landscape requires a structured, automated workflow that leverages intelligent orchestration and AI-driven tools to optimize execution across diverse environments and shrinking release windows.
Establishing a Structured Automation Workflow
A structured automation workflow is a predefined sequence of coordinated actions, decision points, and integration interfaces that guide test artifacts from initial requirements through final analysis. By standardizing handoffs, enforcing consistent execution rules, and providing real-time monitoring, the workflow minimizes manual intervention, reduces rework, and ensures traceability.
This approach resolves key challenges:
- Tool Integration Gaps bridged by defining APIs and message formats.
- Process Variability eliminated through enforced sequences and policies.
- Lack of Visibility addressed by dashboards and progress metrics.
- Scaling Constraints overcome with parallelization, load balancing, and dynamic resource allocation.
- Governance and Compliance ensured via automated audit trails and traceable handoffs.
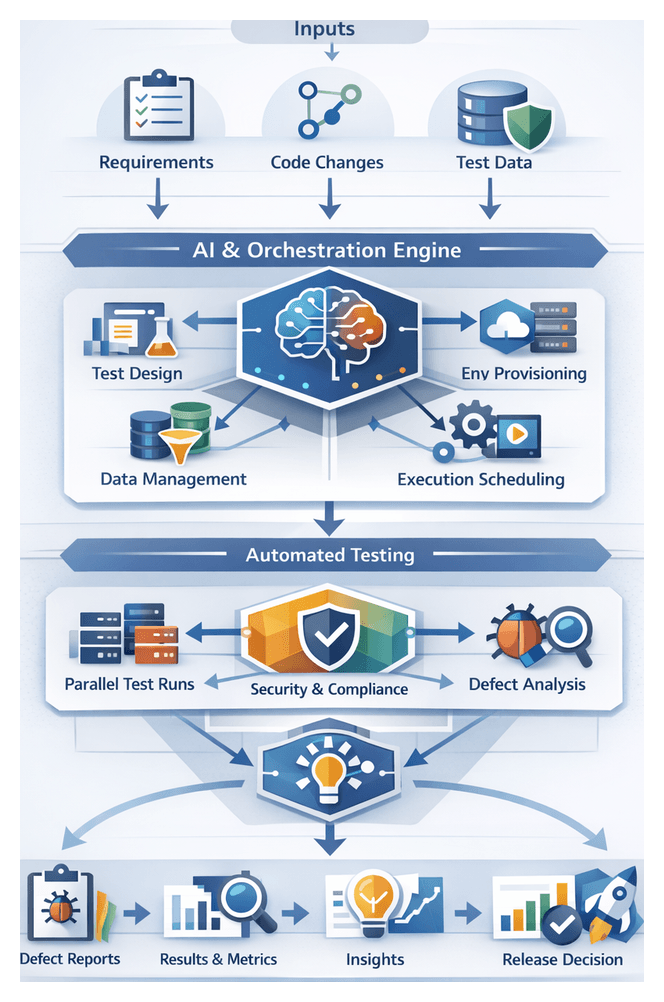
Key Components and Interactions
- Requirement Intake from JIRA or GitLab Issues with completeness validation and triggers for test design.
- Test Design Engine using AI agents and tools such as Selenium to generate and prioritize test cases.
- Environment Provisioner leveraging Terraform or Kubernetes to instantiate isolated test environments.
- Data Manager that anonymizes, synthesizes, and catalogs datasets for compliance and consistency.
- Execution Scheduler integrating with Jenkins or GitLab CI to orchestrate parallel test runs.
- Defect Analyzer applying machine learning to classify failures and assign root causes before routing to issue trackers.
- Reporting Dashboard aggregating metrics, trends, and predictive insights for release readiness.
Coordination and Traceability
Effective workflows define event triggers, approval gates, notification channels, escalation paths, and feedback loops. Each artifact—requirement, test case, environment configuration, dataset, or defect report—carries unique identifiers, with metadata that capture timestamps, actor details, and version information. Bidirectional links connect requirements to test cases, execution runs to environment snapshots, and defects back to code commits, ensuring auditability and rapid root-cause analysis.
Orchestration Mechanisms
- Declarative Pipelines such as Jenkins Pipeline or GitLab CI YAML definitions.
- Event-Driven Orchestration using lightweight event buses and microservices.
- Stateful Workflow Engines like Apache Airflow or Prefect for long-running workflows and visualization.
- AI-Enhanced Orchestrators that adapt workflows based on performance metrics.
Change Management and Continuous Improvement
- Review and Approval Processes for pipeline changes with automated policy checks.
- Version Control of all workflow assets in source repositories.
- Automated Policy Enforcement for security baselines and data privacy.
- Role-Based Access Control for modifying workflows and accessing sensitive data.
- Ongoing measurement of throughput, cycle time, failure rates, resource utilization, defect leakage, and coverage indices to guide AI-driven optimizations.
Positioning AI Agents Across the Testing Lifecycle
AI agents introduce dynamic intelligence across the testing pipeline, complementing traditional automation tools. They perform intelligent analysis, decision support, and continuous optimization—interpreting requirements, generating and prioritizing tests, orchestrating execution, classifying defects, and refining processes over time.
AI Agent Roles and Tools
- Requirement Analysis uses IBM Watson NLU and Azure Text Analytics to extract testable conditions and highlight ambiguities.
- Test Case Generation with Testim and Functionize employing reinforcement and deep learning to create resilient, prioritized scenarios.
- Environment Provisioning where AI modules augment Terraform for predictive capacity planning based on historical utilization.
- Synthetic Test Data Generation using Databricks libraries and GANs/VAEs to produce realistic, compliant datasets.
- Execution Scheduling integrating with Jenkins and GitLab CI/CD to dynamically reschedule or parallelize tests in response to environment health.
- Defect Detection leveraging Splunk for anomaly detection in logs, screenshots, and telemetry.
- Defect Triage with Bugsnag to assess severity and recommend assignment based on impact predictions.
- Result Analysis where Datadog and Power BI deliver trend analyses and release readiness forecasts.
- Continuous Model Refinement using MLflow to manage retraining pipelines driven by post-release metrics and feedback.
Integration with Supporting Systems
AI agents connect to requirement management platforms (JIRA), version control repositories (GitHub, GitLab, Bitbucket), CI/CD pipelines, infrastructure-as-code engines (Terraform, AWS CloudFormation), container orchestrators (Docker, Kubernetes), observability services (Prometheus, OpenTelemetry), and issue trackers (Micro Focus ALM).
Continuous Intelligence and Adaptation
By correlating data across stages—linking requirement changes to test failures or environment metrics to execution success—AI agents identify systemic inefficiencies and recommend corrective actions. Predictive analytics guide capacity adjustments, while reinforcement learning refines scheduling policies, creating a self-improving ecosystem that adapts to evolving demands.
Cohesive Blueprint and Key Artifacts
This blueprint guides practitioners through a modular, AI-driven test automation pipeline composed of stages for requirements integration, test generation, environment provisioning, data management, execution orchestration, defect analysis, triage, insight extraction, and continuous feedback. Each stage produces standardized artifacts, dependencies, and handoff protocols to maintain end-to-end traceability and accountability.
Key Artifacts and Outputs
- Requirements Trace Documents mapping user stories to testable criteria.
- Generated Test Suites with priority rankings and coverage metrics.
- Environment Configuration Manifests in Terraform, Docker Compose, or Kubernetes formats.
- Synthetic Data Catalogs with schemas and generation rules.
- Execution Logs and Reports including performance metrics.
- Defect Metadata Bundles with screenshots, stack traces, and root-cause hypotheses.
- Prioritized Issue Queues and quality insight dashboards.
- Retrained AI Models with version artifacts for continuous improvement.
Dependencies and Integration Contracts
- Requirement Management Platforms (JIRA, Azure DevOps)
- Version Control Systems (GitHub, GitLab, Bitbucket)
- Infrastructure-as-Code Engines (Terraform, AWS CloudFormation)
- Container and Orchestration Services (Docker, Kubernetes)
- Data Stores and Privacy Gateways
- CI/CD Pipelines (Jenkins, GitLab CI)
- Issue Tracking Tools (ServiceNow, GitHub Issues)
- Analytics and Visualization Services (Power BI, custom dashboards)
Handoff Mechanisms and Traceability
- Artifact Repositories with immutability guarantees.
- Message Buses or Event Streaming for real-time notifications.
- RESTful APIs for synchronous payload handoffs.
- Webhook Notifications to collaboration platforms.
- Traceability Matrices automatically mapping artifacts across stages.
Enabling Continuous Feedback
- Model Evaluation Reports feeding retraining pipelines.
- Pipeline Health Dashboards for capacity forecasting.
- User Feedback Aggregates informing requirement updates.
- Defect Resolution Logs guiding prioritization refinements.
By following these outputs, integration contracts, and handoff protocols, organizations can accelerate test throughput, enhance quality assurance, and establish a resilient, adaptable AI-driven pipeline that scales with business needs.
Chapter 1: Workflow Overview and Objectives
Defining Scope and Inputs for AI-Driven Testing
A successful AI-orchestrated testing pipeline begins with clearly defined scope boundaries and well-structured inputs. Aligning objectives across development, QA, operations, and AI engineering ensures that automation efforts deliver measurable value while avoiding scope creep. This stage establishes what to automate—functional modules, test types, target environments, data domains, and integration points—and outlines exclusions for later phases. By documenting scope in requirement management systems such as Jira or Azure DevOps Boards, teams create a shared reference that drives consistent decision-making, resource allocation, and traceability from user stories to test outcomes.
Key prerequisites for workflow activation include:
- Version Control Integration via GitHub, GitLab or Bitbucket
- Infrastructure-as-Code definitions using Terraform or Ansible, and container orchestration through Docker and Kubernetes or OpenShift
- Artifact repositories such as GitHub Packages, Nexus Repository or Artifactory
- Compute resources for model training on platforms like AWS SageMaker or Google Cloud AI Platform
- Security and compliance frameworks governing data anonymization and access control
- Collaboration channels in Slack or Microsoft Teams
- Governance forums defining KPIs, metrics and stakeholder alignment
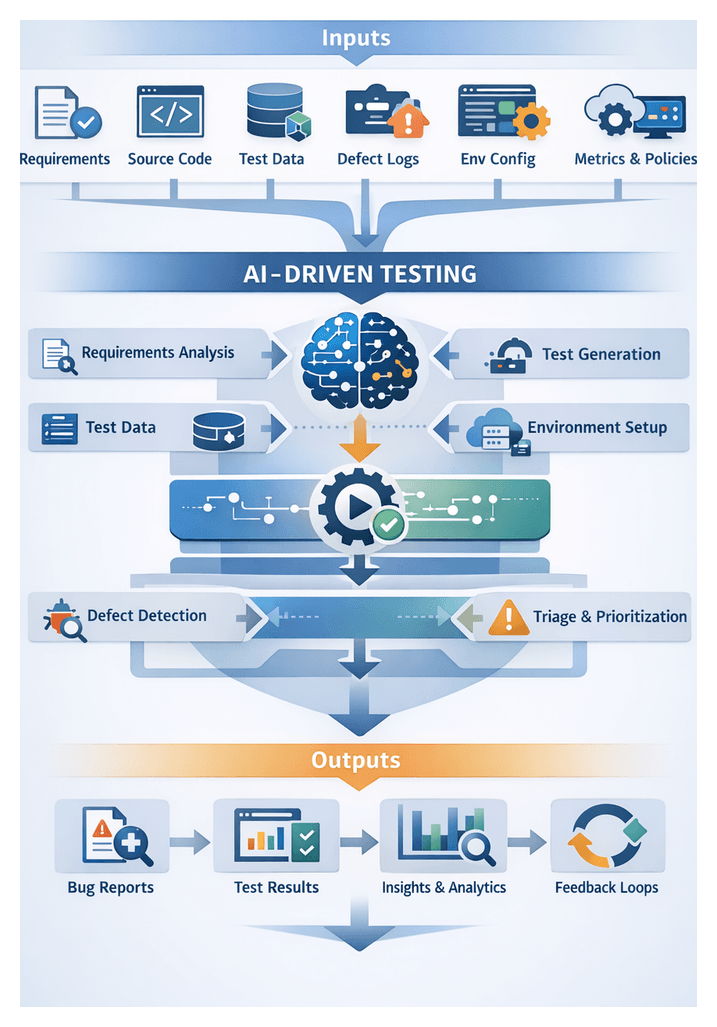
Primary inputs enable AI agents to generate, execute, and analyze tests with contextual awareness. These include:
- Requirement specifications and user stories in machine-readable form
- Source code, API definitions (OpenAPI/Swagger) and build artifacts
- Historical test artifacts from frameworks like Selenium WebDriver and Cypress
- Defect logs from Jira or Azure DevOps and performance data from tools such as New Relic or Datadog
- Environment configuration and service dependency metadata
- Test data profiles for volume, domain and privacy constraints
- Baseline quality and performance benchmarks
- Scheduling and priority rules tied to release timelines and regulatory deadlines
Decision criteria—test coverage thresholds, risk tolerances, acceptable false positive rates, and escalation rules—are embedded in governance documents. Early proof-of-concept pilots validate readiness, uncover tool compatibility gaps, and set the stage for scalable AI-driven workflows.
Mapping the End-to-End Workflow
Mapping workflow steps and transitions provides visibility into dependencies, system integrations, and decision gates. A high-level pipeline comprises:
- Requirements Ingestion and Validation
- Test Planning and Automated Case Generation
- Environment and Data Provisioning
- Execution Orchestration and Scheduling
- Defect Detection and Classification
- Dynamic Triage and Prioritization
- Insight Extraction and Feedback
Stage 1: Requirements Ingestion and Validation
User stories and acceptance criteria are ingested from Jira or Azure DevOps. AI agents apply NLP to extract testable conditions, validate completeness, assign risk-based priority tags, and generate clarification requests. Approved requirements and trace IDs are stored in a central repository for downstream traceability.
Stage 2: Test Planning and Automated Case Generation
Platforms like Testim and GitHub Copilot analyze requirement metadata, source code repositories, and historical defect patterns to generate and prioritize test suites. Generated cases are submitted via pull requests to a Git-backed test repo, reviewed by test leads, and tagged with execution constraints.
Stage 3: Environment and Data Provisioning
Infrastructure orchestration tools (Terraform, Ansible) provision containers or VMs. AI-driven capacity models forecast resource needs and balance cost with performance. Synthetic data engines such as Gretel.ai and DataRobot generate anonymized datasets. Environment health checks validate network and schema integrity before promotion to the execution queue.
Stage 4: Execution Orchestration and Scheduling
CI/CD orchestrators like Jenkins, GitHub Actions or GitLab CI distribute test suites in parallel, sequence smoke tests, and monitor telemetry. AI monitoring agents predict node failures and reroute tasks mid-run to meet throughput targets. Logs and metrics are aggregated for real-time visibility.
Stage 5: Defect Detection and Classification
AI engines such as Applitools and Dynatrace ingest logs, screenshots and performance data. Machine learning models identify anomalies, classify defects by severity and root cause, and enrich tickets with contextual metadata before filing them in the issue tracker.
Stage 6: Dynamic Triage and Prioritization
Risk models evaluate business impact based on usage patterns, historical resolution times and compliance factors. High-risk defects are routed to subject matter experts or scheduled for hotfix sprints. Automated escalation enforces SLAs and dashboards provide backlog transparency.
Stage 7: Insight Extraction and Feedback
Analytics platforms, integrated via OData feeds or direct connections to tools like Power BI and Tableau, aggregate execution metrics and defect trends. Predictive models forecast release readiness, flag coverage gaps and recommend optimizations. Continuous feedback informs requirement refinement, test heuristics and capacity planning.
AI Functions Across the Workflow
AI capabilities—NLP, classification, predictive analytics, anomaly detection and reinforcement learning—embed intelligence at every stage. Key functions include:
Requirement Ingestion and Mapping
NLP agents extract entities, generate traceability links to existing test cases or code modules, and flag ambiguities in platforms like Jira or IBM DOORS Next.
Test Case Generation and Prioritization
Tools such as GitHub Copilot and Testim propose parameterized scripts, optimize coverage and assign risk-based priorities. AI integrates with frameworks like Selenium and Appium to produce executable artifacts.
Environment Provisioning and Capacity Planning
Predictive models in Terraform Enterprise or AWS CloudFormation estimate resource demand, automate provisioning workflows and optimize cost-performance trade-offs.
Synthetic Data Generation
Agents in Gretel.ai and DataRobot learn data distributions and preserve correlations while enforcing privacy constraints to deliver representative test datasets.
Execution Scheduling Adaptation
Reinforcement learning plugins for Jenkins or Azure DevOps dynamically parallelize workloads, reorder tests on failure and trigger self-healing actions when anomalies occur.
Defect Detection and Classification
Engines like Applitools, Dynatrace and Splunk apply computer vision, log pattern recognition and root cause prediction to streamline triage.
Dynamic Triage and Assignment
Risk scoring models integrate with Jira or Azure Boards to automate assignment, escalation and reprioritization based on real-time data.
Result Analysis and Predictive Insights
Machine learning extensions for Power BI or Tableau forecast defect hotspots, estimate on-time delivery and calculate quality health scores.
Continuous Feedback and Model Refinement
MLOps platforms like MLflow and Kubeflow orchestrate data collection, model retraining and versioned deployment to maintain AI accuracy and adapt to evolving application behavior.
Deliverables and Governance Artifacts
- Workflow Diagram mapping stages, decision points and AI functions
- Process Definition Document detailing step narratives, entry/exit criteria and outputs
- Roles and Responsibilities Matrix assigning RACI ownership
- Tooling Inventory and Integration Map cataloguing platforms and integration touchpoints
- Metrics and SLA Catalog defining KPIs, targets and reporting cadence
- Traceability Matrix linking requirements to AI-generated test cases
- Assumptions and Constraints Log documenting dependencies and governance policies
All artifacts reside in version-controlled repositories like GitHub or centralized document systems, with automated approval workflows and semantic versioning to ensure a single source of truth.
Key Metrics and Success Criteria
Process Efficiency
- Cycle Time per Stage
- Test Throughput per Pipeline Run
- Environment Provisioning Time
Quality and Coverage
- Test Coverage Rate
- Defect Escape Rate
- Classification Accuracy
Operational Reliability
- Execution Success Rate
- Integration Error Rate
- Data Generation Fidelity
AI Model Performance
- Model Accuracy
- Precision and Recall
- Retraining Frequency
Business Impact
- Release Readiness Score
- Mean Time to Detect and Resolve Defects
- Stakeholder Satisfaction Index
Dashboards in Power BI or Tableau integrate data from CI/CD, test management and AIOps tools to provide real-time alerts and periodic KPI reviews.
Dependencies and Assumptions
- Requirements Management in Jira or equivalent with clear versioning
- Existing Automation Frameworks such as Testim or Tricentis Tosca
- Infrastructure-as-Code via Terraform or Kubernetes configurations
- Data Access and Compliance for production-like sources with GDPR/HIPAA guidelines
- AI Model Libraries with available pre-trained NLP and ML models
- Cross-Functional Collaboration across Dev, QA, Security and Ops teams
- Executive Sponsorship for tooling licenses and budget
Assumptions include SME availability for model training, a DevOps culture embracing iterative feedback, and stable connectivity between on-premise and cloud services. A dependency register and mitigation plans address deviations without disrupting the workflow.
Integration Points and Handoffs
- Requirements to Test Generation: Event-driven exports via API or webhooks from Jira or Azure DevOps into AI test generators; confirmation reports returned for sign-off.
- Test Cases to Environment Provisioning: Commits trigger Jenkins or GitLab CI jobs; Terraform or Ansible templates reference test dependencies for environment setup.
- Environments to Execution: Provisioned endpoints and credentials published to the orchestrator; test runners consume serialized suites and emit status events.
- Results to Defect Analysis: Logs, screenshots and metrics streamed to data lakes; AI engines publish structured tickets with severity and root cause metadata.
- Defects to Triage: Classified issues and risk scores forwarded to dashboards; notifications dispatched via email or collaboration tools.
- Insights to Dashboards: Aggregated metrics published through OData feeds to Power BI or Tableau; automated alerts highlight release readiness and trend deviations.
Each handoff is governed by versioned API contracts, secure authentication protocols and error-handling procedures. Comprehensive logging and health checks ensure rapid failure detection and automated recovery or escalation.
Chapter 2: Requirements Integration and Traceability
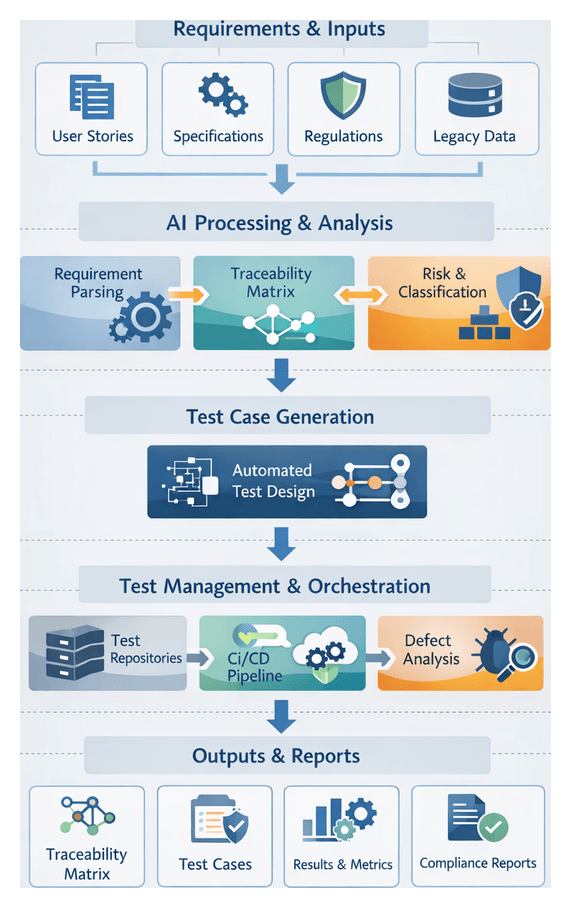
Purpose and Context of Requirement Integration and Traceability
At the outset of any AI-driven testing workflow, capturing requirements and trace inputs establishes the foundation for automated test design, execution, and compliance. This phase consolidates stakeholder needs—business objectives, user stories, use cases—alongside technical specifications, non-functional targets, and regulatory mandates into validated, structured artifacts. By defining clear objectives and scope boundaries, organizations enable bidirectional linkages between requirements and test cases, support natural language processing by AI agents, and ensure audit readiness under frameworks such as ISO 26262, FDA regulations or GDPR.
In an era of distributed teams, microservices, and continuous integration and delivery (CI/CD), manual testing struggles to maintain coverage and speed. AI-driven workflows leverage machine learning, intelligent agents, and orchestration engines to parse requirements, generate test scenarios, and analyze impact. Accurate requirement capture reduces ambiguity, minimizes rework, and accelerates delivery by ensuring automation begins with complete, approved inputs.
Prerequisites and Key Inputs
Effective requirement integration demands:
- Access to stakeholder inputs: business objectives, user personas, acceptance criteria from product owners and end users.
- Integration with platforms such as Jira, Azure DevOps, or IBM DOORS Next.
- Governance workflows for requirement review, approval, and baselining.
- Standardized templates for user stories, use cases, and non-functional requirements.
- Initial traceability matrix framework for linking requirements to design elements and test cases.
Primary inputs include:
- User stories, epics, use cases and scenarios
- Functional and non-functional specifications
- Regulatory standards (HIPAA, PCI DSS, SOX)
- Architectural diagrams, API schemas and data models
- Historical defect and test data for risk-based prioritization
Stakeholders and Early Validation
Collaboration among product owners, business analysts, system architects, QA leads, compliance officers and DevOps engineers ensures high-quality inputs. Early validation through peer reviews, workshops and automated checks for missing acceptance criteria or inconsistent priorities aligns business goals with technical constraints and primes AI agents for accurate parsing and mapping.
Orchestrating the Requirements-to-Test Workflow
Maintaining a structured workflow from requirement intake to test case generation enforces consistency, bidirectional traceability, and auditability. This orchestration integrates requirement management systems, AI analysis engines and test management repositories to reduce manual effort and accelerate the software lifecycle.
Core Workflow Actions
- Intake and normalization
- Automated parsing and classification
- Traceability matrix generation
- Handoff to test design
Intake and Normalization
Connectors extract raw requirements from sources—Jira, Azure DevOps, GitHub Issues—and normalize them into a canonical schema. Fields such as summary, description, acceptance criteria, priority and tags feed downstream AI services.
Automated Parsing and Classification
AI-driven engines apply natural language processing to extract feature sets, identify requirement types and assign risk levels. Requirements are tagged with domain entities, dependencies and suggested test scenarios, guiding the selection of unit, integration, performance or security tests.
Traceability Matrix Generation
The orchestration engine builds an initial matrix mapping requirements to test objectives. Stored in solutions like TestRail or Azure Test Plans, this matrix highlights coverage gaps and enables stakeholder review before test creation.
Handoff to Test Design
Upon matrix approval, structured payloads containing requirement IDs, classification tags, acceptance criteria and artifacts (UI mockups, API specifications) are exported to test case generation tools. Version control records these handoffs, ensuring auditability and rollback capability.
System Interactions and Team Coordination
An event-driven architecture using RESTful APIs, message queues (Apache Kafka, RabbitMQ) and service buses coordinates the flow. Quality engineers, analysts and integrators define mapping rules, refine AI models through feedback loops and maintain integration connectors. Dashboards in Grafana track traceability status and classification confidence, while notifications alert teams to exceptions or mapping conflicts.
Metrics and Benefits
- Requirement Processing Time: latency from submission to matrix update
- Classification Accuracy: ratio of AI classifications accepted without manual correction
- Coverage Ratio: percentage of requirements with linked test scenarios
- Exception Rate: frequency of manual reviews triggered by low-confidence mappings
- Integration Health: success rate of API calls and message deliveries
Structured orchestration accelerates test case generation, improves compliance readiness, enhances cross-team collaboration and creates feedback loops that continuously refine AI agents and mapping rules.
AI Agents in Requirement Analysis
Embodied within the requirements integration and traceability stage, AI agents apply NLP, machine learning and knowledge graphs to transform raw specifications into structured test logic. Their capabilities reduce interpretation errors, scale with parallel development streams and maintain continuous traceability for audit demands.
Key AI Capabilities and Systems
- Natural Language Processing: tokenization, part-of-speech tagging and dependency parsing
- Entity Extraction and Classification: feature names, user roles and business rules
- Semantic Similarity and Clustering: grouping related statements and identifying duplicates
- Knowledge Graphs: domain ontologies capturing entity relationships
- Machine Learning Models: classification of functional, security and performance requirements
- Requirements Management Integrations: Jira, Jama Connect, IBM DOORS Next
- Orchestration Engines: Jenkins, GitLab CI/CD, Azure DevOps
Roles of AI Agents
- Automated Ingestion: Normalizing artifacts from APIs or document stores.
- Semantic Parsing and Annotation: Decomposing statements into actors, actions, conditions and data types.
- Ambiguity Detection: Flagging unclear or conflicting statements and prompting stakeholder clarification.
- Classification and Prioritization: Assigning requirement categories and risk-based priorities using historical defect data.
- Mapping to Test Templates: Selecting test case templates for security, performance, load or functional scenarios.
- Dependency and Trace Link Generation: Creating bidirectional links between requirements, design artifacts and tests.
- Continuous Learning: Refining models with feedback from test execution and defect analysis.
Integration Best Practices
- Toolchain Assessment: Identify integration points and data formats.
- Model Selection and Training: Leverage APIs such as Google Cloud Natural Language API or IBM Watson Natural Language Understanding and train with domain data.
- Workflow Orchestration: Define triggers, processing steps and outputs in an automation engine.
- Human-in-the-Loop: Route low-confidence mappings to experts for review.
- Monitoring and Metrics: Track mapping accuracy, time to generation and trace coverage.
- Governance and Versioning: Maintain model version control and audit trails for annotations.
Embedded AI agents transform requirement analysis into an intelligence-driven practice, reducing ambiguity-driven rework by up to 50 percent, generating test scripts within minutes, and ensuring 100 percent linkage between requirements and test cases.
Traceable Outputs and Handoffs
This stage produces machine-readable artifacts that serve as the authoritative inputs for test design, environment provisioning and execution orchestration. Clear handoff mechanisms preserve traceability and automation efficiency.
Artifact Types and Standards
- Requirement Traceability Matrix (RTM): mapping business requirements to functional specifications and acceptance criteria.
- Testable Criteria Document: formal pass/fail conditions linked to RTM entries.
- API Contract Definitions: OpenAPI or AsyncAPI schemas for automated parsing by Postman.
- Data Model Maps: JSON schemas or entity-relationship diagrams annotated for data synthesis.
- Change Logs: metadata capturing requirement revisions, timestamps and authors.
- Trace Metadata Package: JSON or CSV exports linking requirement IDs in Jira or Azure DevOps.
Standard formats such as ReqIF, IEEE 829 templates and OpenAPI reduce custom integration work.
Dependencies and Integration Points
- Upstream Sources: Requirement platforms (Jira, IBM DOORS Next), document repositories (GitLab, GitHub).
- Downstream Consumers: AI test generators like Testim, Mabl; infrastructure as code tools (Terraform, AWS CloudFormation); data synthesis via Datagen AI; CI/CD pipelines (Jenkins, GitLab CI, Azure Pipelines); BI dashboards (Power BI, Tableau).
Handoff Mechanisms
- API-Based Transfers: push mode via RESTful endpoints or pull mode with incremental polling.
- Event-Driven Notifications: message brokers (Apache Kafka, AWS SNS) and webhooks.
- Artifact Repositories: versioned storage and access control in Nexus or Artifactory.
Quality Gates and Metrics
- Completeness Checks: ensuring every requirement maps to testable criteria.
- Format Validation: schema validators for JSON, XML and OpenAPI.
- Trace Coverage Metrics: dashboards measuring mapping completeness and quality gate pass rates.
- Dependency Verification: automated scans aligning API contracts with data models.
Best Practices for Sustained Traceability
- Consistent Naming Conventions: predictable identifiers (REQ-001, TC-001).
- Automated Synchronization: scheduled sync tasks between platforms and trace repositories.
- Audit Logging: immutable logs of artifact modifications and handoff events.
- Integrated Dashboards: real-time traceability status and KPIs.
- Governance Reviews: periodic human audits complementing automated checks.
By producing structured outputs, validating quality, and automating handoffs, organizations maintain full visibility into requirement coverage and deliver accelerated, compliant testing processes.
Chapter 3: AI-Powered Test Case Generation
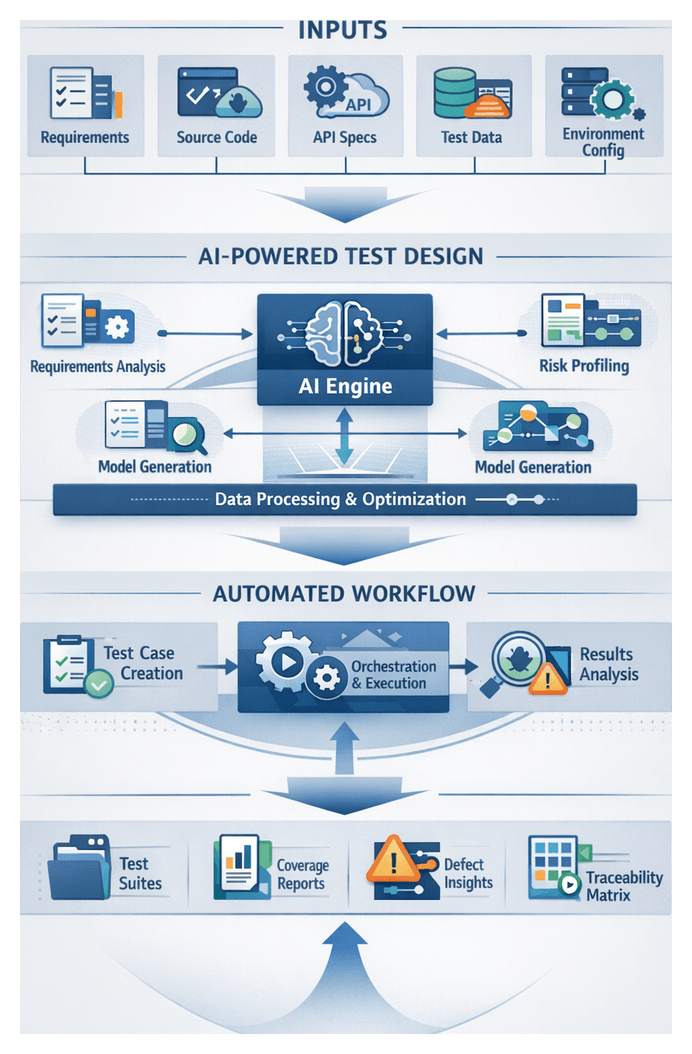
Purpose and Strategic Importance of Automated Test Design
The automated test design stage establishes the foundation for AI-driven generation of test scenarios that align with business requirements, technical specifications, and historical quality insights. By systematically gathering and validating inputs, teams ensure that AI agents produce relevant, maintainable, and traceable test cases. Investing effort in this preparatory stage accelerates test creation, reduces manual overhead, and minimizes the risk of misalignment between testing outcomes and customer expectations.
Strategic Benefits
- Alignment of test scenarios with business priorities and compliance requirements
- Maximization of coverage through data-driven analysis of past defects and risk indicators
- Reduction of duplicate or irrelevant tests by leveraging historical execution results
- Traceability between requirements, test cases, and defects for audit and governance
- Improved maintainability through standardized input formats and metadata tagging
Inputs and Prerequisites for AI-Driven Test Design
Required Inputs
- Functional Requirements and User Stories: Specifications from requirement management systems such as Jira or Azure DevOps, including acceptance criteria, business rules, and user personas.
- Technical Specifications and API Contracts: Interface definitions, API schemas (OpenAPI/Swagger), message formats, and integration guidelines guiding boundary, edge-case, and integration tests.
- Source Code Repositories: Codebases in platforms like GitHub or GitLab for analysis of application structure, dependencies, and logical branches.
- Historical Defect and Test Execution Data: Defect records and execution logs from tools such as TestRail or QMetry, informing prioritization toward high-risk areas.
- Non-Functional Requirements: Performance benchmarks, security policies, compliance mandates (GDPR, HIPAA), and accessibility standards for load, penetration, and compliance tests.
- Domain Models and Data Schemas: Entity-relationship diagrams, data dictionaries, and canonical data models to drive synthetic test data generation.
- Environment and Configuration Definitions: Infrastructure-as-code templates, container specifications, and environment variables outlining deployment contexts.
- Traceability Matrices: Mapping documents linking requirements to existing test cases and defects for bidirectional traceability.
Prerequisites and Governance
- Structured Requirements Management: Centralized, version-controlled systems with standardized templates in Confluence or IBM DOORS.
- Accessible Artifact Storage: APIs or file shares with proper permissions and authentication for automated retrieval.
- Data Quality and Hygiene: Current, accurate inputs with controlled vocabularies, metadata conventions, and validation rules.
- Versioning and Baseline Control: Tags or branches marking stable code and requirement baselines for reproducibility.
- Integration Points and APIs: REST APIs, webhooks, or message queues connecting requirement management, code repositories, defect tracking, and test management systems.
- Governance and Compliance Framework: Policies for data privacy, intellectual property, and auditability with approval gates where necessary.
- Team Alignment and Roles: Defined responsibilities for business analysts, developers, QA engineers, and DevOps practitioners.
- Computational Resources and Security Controls: Sufficient compute capacity, secure infrastructure, access controls, network segmentation, and encryption safeguards.
Data Validation, Preprocessing and Risk Profiling
- Natural language normalization of requirement text to remove ambiguities
- Code parsing and abstract syntax tree generation to identify functions, classes, and control structures
- Schema validation of API definitions against OpenAPI specifications
- Deduplication and classification of historical defects to ensure representative sampling
- Annotation of domain entities with semantic metadata for accurate scenario mapping
- Change impact analysis from version control diffs
- Usage analytics highlighting high-traffic features
- Security advisories indicating vulnerability hotspots
- Regulatory change logs affecting compliance requirements
Structure of an AI-Powered Automation Workflow
Modern software delivery demands a structured end-to-end automation workflow that unifies teams, tools, and data flows. By codifying clear stages, triggers, and integration points, organizations eliminate ad hoc practices, accelerate feedback loops, and ensure scalable, reliable test outcomes.
Orchestration Layer
Engines such as GitLab CI or CircleCI coordinate sequence, parallelization, and conditional flows. AI agents adjust scheduling in real time based on environment health or test queue backlogs.
Integration Points and APIs
Webhooks and standardized APIs enable seamless communication. For example, merging a feature branch triggers Testim for test case generation and an API call to Terraform for environment provisioning.
Data and Artifact Exchange
Uniform schemas such as Test Anything Protocol (TAP) or JUnit XML ensure compatibility across execution engines and analytics dashboards. Synthetic datasets from platforms like mabl are injected automatically, eliminating manual data imports.
Governance and Visibility
Automated metrics—coverage reports, environment utilization, defect summaries—feed central dashboards. Role-based access controls and audit trails enforce compliance and maintain data integrity.
Coordination Across Teams and Tools
- Development to Test Handoff: Feature branches trigger AI agents to analyze code diffs and requirements, proposing scenarios to test management via API. Notifications inform QA of new suites for review.
- Test to Environment Provisioning: The orchestration layer invokes infrastructure-as-code scripts. AI-driven capacity planners predict resource needs for parallel execution.
- Execution to Defect Analysis: Runners output structured logs and telemetry. An AI defect detection service classifies failures and logs issues in tools such as Sauce Labs TestOps or Jira.
AI Models and Techniques for Scenario Generation
Machine learning and model-based techniques transform requirements, code artifacts, and historical data into executable test scenarios. This approach increases coverage, reduces design time, and adapts rapidly to evolving logic.
Key AI Techniques
- Natural Language Processing (NLP) for requirements interpretation via named entity recognition and dependency parsing.
- Model-Based Testing using finite state machines, decision diagrams, or Petri nets derived from interface definitions and code annotations.
- Pattern Mining with clustering and association rule mining on execution logs and defect repositories.
- Reinforcement Learning agents exploring scenario space, guided by defect discovery rates, coverage metrics, and performance thresholds.
Roles of AI Models
- Requirement Analyzer: Converts unstructured specifications into structured intent graphs.
- State Model Refiner: Updates formal models to reflect code and interface changes.
- Scenario Synthesizer: Generates candidate test cases by traversing models and instantiating parameters.
- Coverage Optimizer: Prunes and prioritizes scenarios based on risk and resource constraints.
- Feedback Integrator: Recalibrates models using execution results and defect outcomes.
Integration with Supporting Systems
- Requirements platforms such as Jira or IBM DOORS Next.
- Code repositories like GitHub, Subversion, or Azure Repos.
- Test management tools including TestRail and frameworks such as Selenium, Cypress, or UFT.
- CI/CD systems like Jenkins or GitHub Actions for continuous validation.
Continuous Learning and Model Refinement
- Monitor metrics such as defect yield, coverage contributions, and false positive rates.
- Collect feedback from execution logs, test outcomes, and tester annotations.
- Retrain models using platforms like Google Cloud AutoML or Microsoft Azure Machine Learning.
- Version and validate models with registry tools and A/B evaluations.
- Deploy improved models with rollback capability to production AI agents.
Case Example
Integrating Diffblue Cover for code-based scenarios with Test.ai for UI pattern learning resulted in a 30% reduction in test design time and a 20% improvement in functional coverage. Static analysis and reinforcement learning agents synchronized models and shared feedback, delivering unified backend and frontend test suites.
Generated Test Artifacts and Traceability
AI-powered test case generation produces a structured collection of artifacts that bridge requirements and execution frameworks. These outputs are comprehensive, consistent, and versioned for maintainability.
Artifact Types
- Test Definition Files: JSON, YAML, or DSL files detailing actions, parameters, expected outcomes, and exception paths.
- Metadata Manifests: Attributes such as priority, tags, estimated runtime, required data profiles, and preconditions.
- Requirement Traceability Matrix Entries: Bidirectional links between test cases and requirements, exportable to ALM platforms.
- Environment Configuration Snippets: Variables for URLs, credentials, feature flags, or container images.
- Test Data Profiles: Schema definitions and sample payloads for synthetic or masked datasets via Mabl or internal tools.
- Version Control References: Commit SHAs or branch tags aligning tests with specific application versions.
Dependency Management
Artifacts are annotated with:
- Requirement identifiers and excerpts of acceptance criteria.
- Classification of requirement types (functional, security, performance, compliance).
- Environment characteristics: OS, browser variants, service endpoints, API contract versions, data schema states, and network profiles.
Versioning and Change Management
- Store test definitions in version control with branch policies mirroring feature development.
- Apply semantic or date-based tags to distinguish artifact releases.
- Trigger AI-driven regeneration on requirement updates, producing draft tests in feature branches for review.
Handoffs to Test Execution
- Artifact Publishing: Definitions and manifests published to a shared registry detected by Jenkins, Azure DevOps, or Testim agents.
- API Registration: Orchestrators accept HTTP POST requests containing artifacts and environment tags for dynamic scheduling.
- Event-Driven Queues: Generation events published to Kafka or AWS EventBridge, with downstream consumers initiating execution workflows.
Traceability and Auditability
- Timestamps, AI engine version, and identity of the generating agent.
- Snapshots of requirement text and code baselines used as inputs.
- Rationales for scenario creation, including key phrases identified by NLP.
- Change logs detailing differences between successive test generations.
Metrics and Reporting
- Generation Throughput: Number of test cases produced per requirement per period.
- Coverage Ratio: Percentage of requirements with associated test cases by feature or component.
- Redundancy Index: Overlap between scenarios, highlighting consolidation opportunities.
- Defect Detection Rate: Ratio of defects found by generated tests versus manual suites.
- Traceability Completeness: Proportion of artifacts with valid links to requirements, environments, and version tags.
Best Practices for Managing Output Artifacts
- Define naming conventions, schema standards, and version tagging policies via a central governance team.
- Implement automated validation gates to verify artifact schema conformance before handoff.
- Enforce role-based access control on artifact repositories.
- Conduct periodic reviews to retire obsolete scenarios and refine AI model parameters.
- Integrate feedback loops from execution results and defect classification to improve generation accuracy.
Continuous Improvement and Optimization
A structured automation workflow evolves through feedback loops, data-driven insights, and periodic reviews. Key performance indicators guide refinements in throughput, coverage, and quality.
- Cycle Time: Time from code commit to test report availability, minimized through parallelization and AI-driven scheduling.
- Test Coverage and Redundancy: Analytics identify low-value or overlapping tests for removal or consolidation.
- Defect Detection Rate: Focus on early detection by enhancing scenario generation and classification accuracy.
- Resource Utilization: Predictive planning models forecast demand to prevent contention during peak periods.
Regular retrospectives and governance reviews analyze KPI trends and AI model performance. Model retraining cadences ensure alignment with evolving applications, while version-controlled pipeline definitions enable safe experimentation and rollback. Through continuous learning and structured workflows, organizations achieve higher quality at unprecedented speed.
Chapter 4: Infrastructure and Environment Automation
Purpose and Context of Environment Provisioning Stage
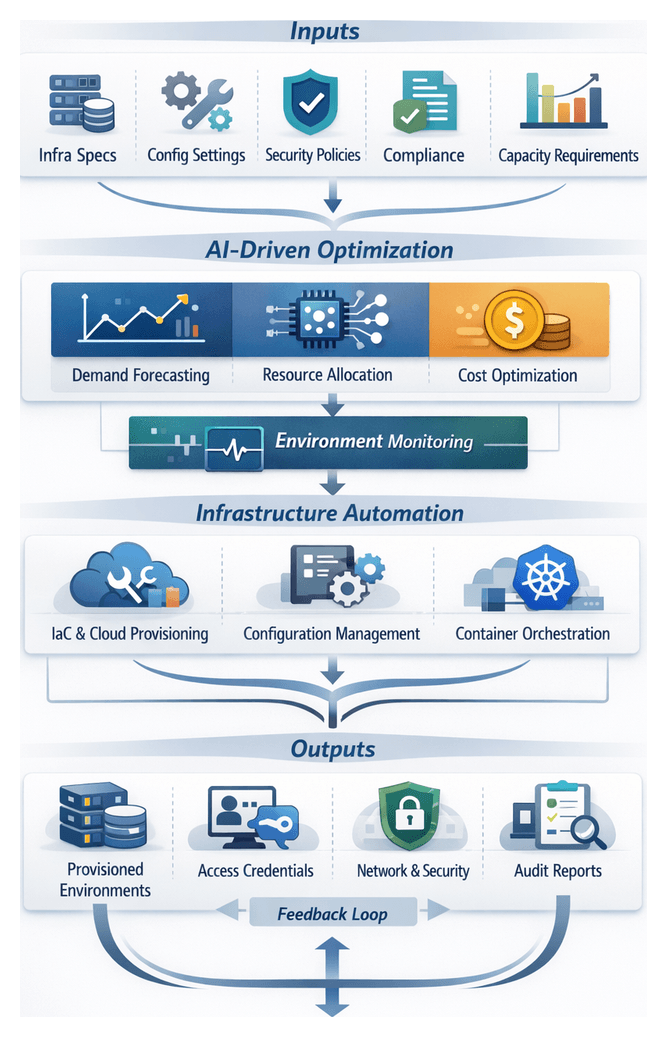
The environment provisioning stage establishes the infrastructure foundation for AI-driven testing workflows. It ensures that compute, networking, storage, and configuration resources are consistent, reproducible, and aligned with application requirements and production conditions. By defining precise prerequisites and inputs, this stage reduces false positives, accelerates defect identification, and enables parallel test execution without manual intervention. Over the past decade, the rise of microservices, containerization, and cloud-native architectures has driven adoption of Infrastructure as Code (IaC) tools such as Terraform and AWS CloudFormation, alongside container orchestration platforms like Kubernetes, to automate environment definitions and provisioning at scale.
In an AI-enhanced context, environment provisioning integrates predictive capacity planning, policy-driven security checks, and continuous feedback loops. AI agents leverage telemetry and historical data to forecast resource demands, optimize cost, and adjust allocations dynamically. This holistic approach streamlines automated workflows, aligns DevOps and QA teams, and embeds governance controls for auditability and compliance.
Core Inputs and Prerequisites
Effective environment provisioning relies on well-defined inputs that guide infrastructure automation tools and AI agents. The following categories capture essential specifications:
- Infrastructure Specifications: Compute profiles (CPU, memory, GPUs), storage types, OS images, and network interfaces. In cloud contexts, this translates to instance types, block volumes, and virtual network settings.
- Configuration Definitions: Software packages, middleware, environment variables, and startup scripts managed by tools like Ansible or Chef. Versioned repositories and YAML manifests ensure reproducibility and rollback capability.
- Network and Security Constraints: Virtual private networks, firewall rules, load balancer settings, and security group configurations. Policy checkers validate encryption, certificate management, and identity provider integrations prior to provisioning.
- Compliance and Governance Inputs: Framework references (GDPR, HIPAA, PCI DSS), data encryption requirements, logging retention policies, and segregation of duties. Compliance scanners cross-verify IaC definitions to produce audit-ready artifacts.
- Resource Quotas and Capacity Profiles: Limits on compute, storage, and network utilization per test run or project. Autoscaling policies reflect capacity thresholds and cost-center tagging supports chargeback and cleanup routines.
- Integration Points and Handoff Definitions: Metadata outputs (URLs, credentials, resource IDs) and status indicators consumed by CI/CD tools such as Jenkins or GitLab CI. Clear handoff schemas enable seamless transitions to test data preparation, execution, and teardown.
Best practices include maintaining a centralized IaC repository, parameterizing modules for multi-environment deployments, and incorporating linting and validation steps to catch schema drift early.
AI-Driven Capacity Planning and Allocation
Traditional static resource allocation often leads to idle capacity or bottlenecks. AI-driven capacity planning addresses this by forecasting demand and automatically adjusting resources ahead of test execution. Key components include:
- Predictive Demand Forecaster: Machine learning models—time series algorithms (ARIMA, Prophet), regression trees, and LSTM networks—analyze historical test logs, CI/CD triggers, and external signals (release schedules, feature toggles) to estimate resource requirements.
- Dynamic Resource Allocator: Reinforcement learning agents and policy-based controllers determine optimal compute, memory, and network allocations within predefined risk thresholds.
- Cost Optimization Advisor: Evaluates spot instances, reserved capacity, and rightsizing opportunities to minimize infrastructure spend while maintaining reliability.
- Environment Health Monitor: Continuously ingests telemetry from monitoring platforms like Prometheus and Grafana to detect anomalies and trigger scaling overrides or rollback actions.
Integration with IaC pipelines enables AI-generated plans to be enacted via Terraform modules, Kubernetes Cluster Autoscaler, and cloud-native autoscaling services (AWS Auto Scaling, Azure VM Scale Sets, Google Cloud Instance Groups). Closed-loop feedback compares predicted versus actual usage and refines forecasting models, while approval gates and audit trails maintain human oversight for significant budget impacts.
Key Deliverables and Artifacts
The automated environment provisioning stage produces a set of versioned artifacts that define, instantiate, and validate test environments. Deliverables include:
- Infrastructure-as-Code templates for Terraform and AWS CloudFormation, stored in version control alongside application code.
- Configuration management playbooks for Ansible or Chef, parameterized for environment variants.
- Container definitions and orchestration manifests—Docker images, Kubernetes Deployment YAML, and Helm charts—with tagged registries for traceability.
- Network and security blueprints specifying subnets, security groups, load balancers, and encryption policies.
- Service endpoint registry cataloging URLs, DNS records, ports, and authentication endpoints.
- Environment metadata and inventory in machine-readable formats (JSON, YAML) listing resource IDs, zones, capacities, and cost metrics.
- Automated health check reports capturing service availability and performance metrics against predefined thresholds.
- Access credentials and secret references managed by HashiCorp Vault, AWS Secrets Manager, or Azure Key Vault.
Version Control and Dependency Management
Rigorous version control prevents configuration drift and ensures consistency across test runs. Strategies include:
- Module registries (public or private) with pinned versions for IaC components and playbooks.
- Semantic versioning of configuration playbooks, container images, and manifests following major.minor.patch conventions.
- Immutable infrastructure patterns that replace resources rather than patching them in place.
- Dependency graph generation tools to sequence provisioning based on resource interdependencies.
- CI pipelines in Jenkins or GitLab CI for automated linting, plan-only previews, and approvers in code review processes.
- Environment-specific variable overlays to separate dev, staging, and production configurations.
Handoff, Cleanup, and Teardown Mechanisms
Seamless handoff of environment artifacts to test execution and efficient teardown are crucial for resource hygiene and cost control. Key mechanisms include:
Environment Metadata Publication
- Publishing environment identifiers and tags linked to commit hashes.
- Exposing service endpoint definitions in JSON or YAML for programmatic consumption by test runners.
- Enforcing metadata schemas to validate field types and required parameters.
Secrets and Credentials Provisioning
- Test orchestrators retrieve secrets via HashiCorp Vault, AWS Secrets Manager, or Azure Key Vault using time-scoped permissions.
- Secrets references are injected as environment variables or configuration inputs without embedding sensitive data in code.
- Audit logs record retrieval events for compliance and forensic analysis.
Notification and Event Triggers
- Messages on EventBridge or Kafka trigger CI/CD pipelines in CircleCI or GitLab CI/CD to launch test jobs.
- Dashboards update environment status flags for visibility across teams.
- Webhooks notify orchestration services when environments reach a “ready” state.
Cleanup and Teardown
- CI/CD teardown jobs invoke IaC destroy commands or cloud APIs to remove resources tagged with environment identifiers.
- Conditional logic retains environments of failed runs for debugging, while automatically destroying successful runs after a retention period.
- Shared service cleanup deregisters test-specific endpoints without disrupting common infrastructure.
- Resource usage reporting informs cost allocation and capacity optimization.
Metrics, Reporting, and Traceability
Comprehensive metrics and audit artifacts enable continuous improvement and compliance:
- Provisioning lead time from initiation to validation, highlighting IaC or script bottlenecks.
- Error and failure logs forwarded to Prometheus, ELK Stack, or other log management systems.
- Resource utilization reports during provisioning and test execution for rightsizing decisions.
- Compliance artifacts demonstrating encryption, network segmentation, and security policy enforcement.
- Capacity forecast dashboards projecting future needs based on historical trends.
- Versioned IaC commits and execution logs mapping code changes to deployed environments.
- Approval records and policy check outputs documenting manual and automated decision points.
- Environment lineage graphs illustrating module ancestry and override layers for impact analysis.
By consolidating these inputs, AI-driven allocation strategies, deliverables, and governance mechanisms, the environment provisioning stage supports a deterministic, scalable, and auditable foundation for AI-enhanced test automation. Subsequent stages—data preparation, test execution, and defect analysis—consume these artifacts to deliver rapid feedback and predictive quality insights across the software delivery pipeline.
Chapter 5: Synthetic Test Data Generation and Management
Establishing Data Requirements and Profiling Inputs
The first stage in synthetic test data generation defines the data requirements and establishes a detailed profile of existing datasets. This foundational step aligns test objectives with compliance mandates, captures statistical and relational properties of production systems, and informs the design of realistic, privacy-preserving synthetic data. By profiling data characteristics, teams mitigate the risk of misrepresentation, uncover edge cases, and build scalable data provisioning workflows.
Key outcomes include:
- High-fidelity data models that preserve distributions, constraints, and referential patterns
- Identification and classification of sensitive elements requiring masking, tokenization, or anonymization
- Documentation of business rules, domain logic, and validation criteria
- Alignment with regulatory frameworks such as GDPR, CCPA, and HIPAA
- Consensus between data engineering, compliance, and testing stakeholders
Prerequisites and Tooling
Execution of this stage depends on securing access to source environments, maintaining metadata catalogs, and leveraging automated profiling platforms. Core prerequisites include:
- Secure connectivity to transactional databases, data warehouses, and data lakes
- Up-to-date schema and lineage metadata from Informatica and Collibra
- Stakeholder alignment among business analysts, data stewards, and compliance officers
- Profiling tools like Trifacta and DataRobot to automate metric collection at scale
- Defined security policies governing data handling, anonymization thresholds, and retention
Profiling Activities and Success Metrics
Automated profiling uncovers data patterns and generates metrics that inform synthetic data models. Typical activities include:
- Schema Discovery: Extracting table and column metadata, data types, length constraints, and index definitions
- Statistical Analysis: Calculating cardinality, value frequency, distributions, mean, median, and standard deviation
- Pattern Recognition: Detecting regular expressions, date formats, and custom string patterns
- Anomaly Detection: Identifying outliers using AI techniques to ensure coverage of edge cases
- Referential Integrity Checks: Mapping parent-child relationships and detecting orphan records
- Sensitivity Classification: Tagging PII via Collibra Data Intelligence modules
To gauge profiling effectiveness, teams define acceptance criteria such as:
- Coverage ratio of profiled fields versus overall schema scope
- Data quality score derived from completeness, consistency, and validity metrics
- Null density to guide synthetic null value injection
- Uniqueness ratio to preserve high-cardinality distributions
- Anomaly rate to inform edge-case generation
- Sensitivity coverage aligned with approved anonymization methods
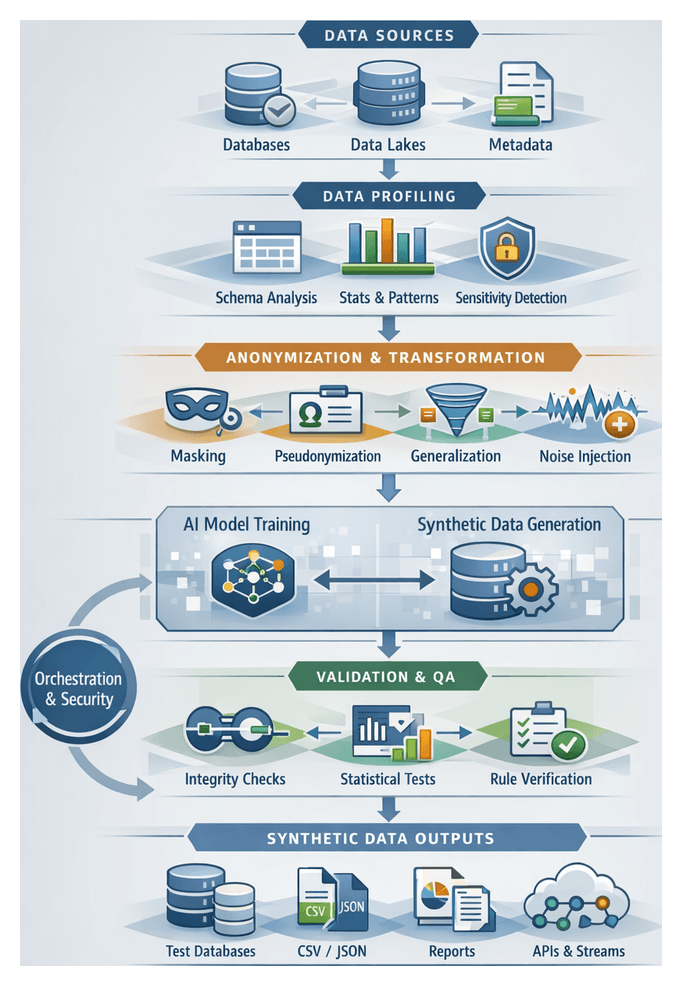
Synthetic Data Generation Workflow
Data Ingestion and Profiling
Source system integration uses secure connectors—such as Fivetran pipelines or custom extract scripts—to ingest data into a staging environment. Profiling engines, including Collibra and open-source alternatives, calculate metrics on cardinality, uniqueness, and null ratios. AI-driven modules detect hidden correlations and anomalies, populating a metadata catalog that drives anonymization and synthesis.
Anonymization and Transformation
Privacy transformations protect sensitive values via a combination of techniques orchestrated by engines like Apache Airflow:
- Masking and Tokenization: Replacing identifiers with irreversible tokens generated by Vault Enterprise
- Pseudonymization: Substituting real-world keys with consistent pseudonyms to preserve referential integrity
- Generalization: Converting granular data (timestamps, ages) into broader categories
- Noise Injection: Adding calibrated noise to numeric fields to maintain statistical validity
Every transformation is logged for auditability, with role-based approval gates enforcing compliance before proceeding.
Data Modeling and Schema Mapping
AI-assisted schema mapping tools infer foreign key relationships, propose synthetic reference tables, and enforce constraints. Key activities include:
- Entity Relationship Extraction: AI agents analyze catalogs to identify associations and lookup tables
- Constraint Enforcement: Defining primary key uniqueness, not-null rules, and domain validations
- Business Logic Incorporation: Reviewing and adjusting inferred rules so synthetic data reflects valid real-world scenarios
Synthetic Data Modeling and Synthesis
Platforms such as Tonic.ai and Databricks orchestrate generative models to produce synthetic records:
- Model Training: Training GANs or VAEs on profiled metrics to learn underlying distributions
- Sampling and Synthesis: Generating records at volume targets that cover edge cases and rare combinations
- Deterministic Generation: Managing seeds to reproduce identical datasets for regression testing
AI-driven monitors detect distribution drift and adjust parameters to maintain fidelity to production patterns.
Validation and Quality Assurance
Generated datasets undergo structural, semantic, and statistical validation:
- Structural Checks: Comparing generated schemas against expected definitions
- Referential Integrity: Verifying foreign key resolutions within synthetic tables
- Statistical Validation: Measuring differences in histograms, correlation matrices, and summary statistics
- Domain Rule Verification: Executing business rule engines (e.g., balance non-negativity, valid date sequences)
Failures trigger alerts in centralized monitoring platforms like ELK or Datadog, and human review gates allow parameter adjustments before continuation.
Orchestration, Security, and Compliance Controls
Workflow Orchestration
A central scheduler sequences tasks, manages dependencies, and coordinates parallel execution. Core capabilities include:
- Dependency Tracking: Ensuring profiling completes before anonymization begins
- Parallel Execution: Running environment-specific workflows concurrently
- Error Handling: Automated retries and escalations for persistent failures
- Audit Logging: Capturing execution metadata for traceability
Security and Compliance
Every workflow stage enforces privacy regulations and security policies:
- Data encryption at rest and in transit (AES-256, TLS)
- Role-based access control integrated with identity providers
- Policy enforcement via Collibra or Informatica
- Immutable audit trails recording run initiators, parameters, and outputs
- Automated data retention policies to purge raw and intermediate data
Delivery and Consumption of Synthetic Data
Artifact Types and Formats
Synthetic datasets are exported in multiple formats to support diverse test environments:
- CSV for scripts and analysis tools
- Apache Parquet for large-scale analytics
- JSON and Avro for API and event-driven testing
- SQL dumps for relational database population
- BSON/JSON for document stores
Metadata, Lineage, and Traceability
Each dataset is accompanied by machine-readable metadata capturing schema definitions, generation parameters, lineage records, and quality metrics. Registries such as SDV or AWS Glue ensure transparency and support auditability.
Compliance and Quality Reports
Automated reporting validates privacy and data quality requirements:
- Privacy assessments (k-anonymity, differential privacy, re-identification risk)
- Statistical validation (histograms, chi-square tests, KS statistics)
- Schema conformance logs for constraint violations
- Audit trails of generation runs and user approvals
Platforms like DataRobot AI Cloud and Gretel.ai provide built-in modules for privacy and quality reporting.
Integration with Test Execution Pipelines
Synthetic data is handed off via:
- Direct Database Population: Automated loaders ingest dumps into test databases
- API-Driven Ingestion: Endpoints exposed by Informatica Intelligent Cloud Services
- Artifact Repositories: Versioned stores such as Nexus or Artifactory
- Message Streams: Publishing payloads to Apache Kafka or AWS Kinesis
Consumption Patterns Across Test Stages
- Test Design: Sample datasets for parameterized scenario development
- Integration Testing: Representative records delivered via APIs or fixtures
- Performance Testing: Bulk exports in Parquet or JSON for load generators
- User Acceptance: Realistic, privacy-compliant user profiles for stakeholder validation
Automated Handoff Mechanisms
- Pipeline Triggers: Jobs initiated by Jenkins, GitLab CI, or Azure DevOps
- Webhooks and Callbacks: HTTP notifications to downstream services
- Message Brokers: Topics in RabbitMQ or Kafka signal dataset readiness
- RESTful APIs: Endpoints for dataset retrieval (e.g., /datasets/latest)
Continuous Improvement and Feedback Loops
Validation metrics and user feedback drive ongoing refinement of profiling and generation processes. Key practices include:
- Metric-Driven Tuning: Adjusting anonymization parameters and generation algorithms based on distribution drift and rule violations
- Model Retraining: Triggering GAN and VAE retraining pipelines with fresh production snapshots
- User Feedback Integration: Incorporating test team insights to close realism and coverage gaps
Roles, Responsibilities, and Best Practices
Clear ownership and governance ensure reliability and compliance:
- Data Engineers: Build pipelines, manage profiling and transformations
- AI Specialists: Develop generative models and oversee training
- Compliance Officers: Define privacy policies and approve anonymization rules
- Test Environment Managers: Provision environments and manage dataset handoffs
- Orchestration Administrators: Maintain workflow engines and scheduling
Adherence to versioned, immutable artifacts; validation gates; comprehensive documentation; and proactive monitoring minimizes friction between data generation and test execution, accelerating delivery while upholding data governance and security.
Chapter 6: Automated Test Execution and Scheduling
Purpose of Automated Test Execution
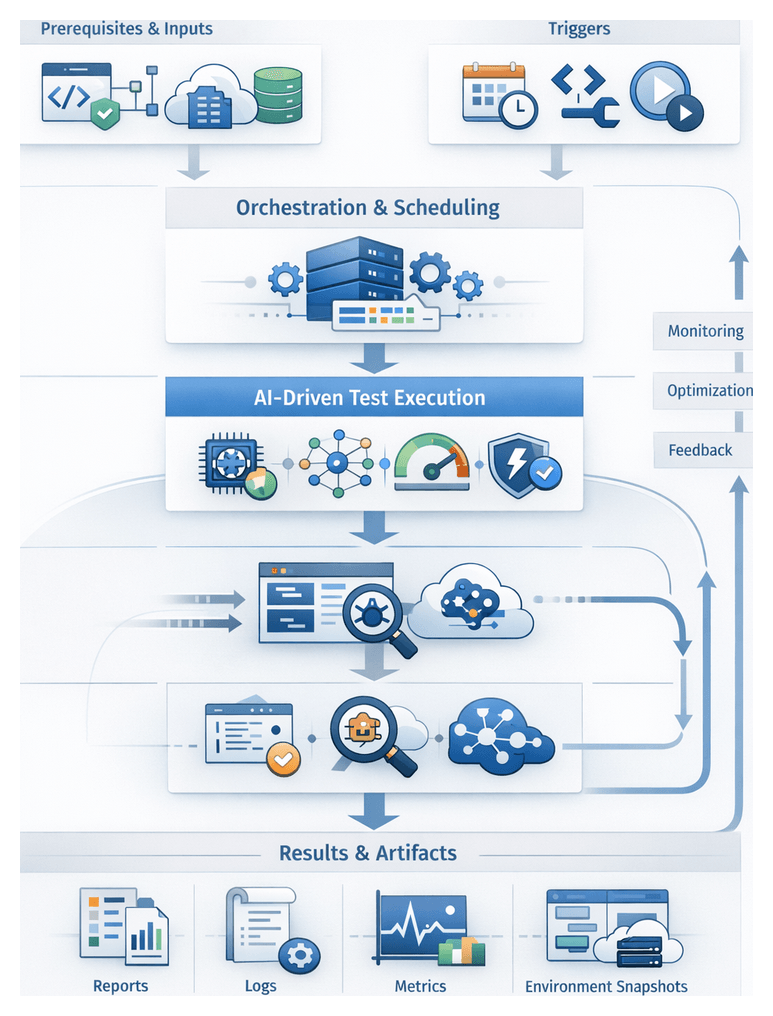
The automated test execution stage is the critical bridge between test design and result analysis, enabling continuous integration and delivery pipelines to validate application behavior under realistic conditions without manual intervention. By defining precise inputs—from code artifacts and configurations to environment endpoints and test data—and codifying trigger conditions, teams ensure tests run only when prerequisites are satisfied, minimizing resource waste, reducing false failures and delivering rapid, reliable feedback. In highly dynamic delivery environments, clear guardrails around execution timing and dependencies prevent cascading failures, resource contention and loss of confidence in the pipeline.
Prerequisites and Inputs
Execution Prerequisites
- Code and Artifact Readiness: Successful merge into the target branch or completion of a build job that passes static analysis, compilation and unit tests. Build artifacts—binaries, Docker images or serverless packages—must be published to a repository.
- Environment Provisioning and Health: Cloud resources, container clusters and external service mocks must be provisioned with completed health checks. Monitoring platforms such as Datadog or Prometheus can feed health signals.
- Configuration and Secrets Injection: Environment variables, configuration files and secrets (API keys, credentials) must be loaded via a secure vault or secrets manager such as HashiCorp Vault or AWS Secrets Manager.
- Test Data Preparation: Synthetic or masked datasets must be staged to match expected scenarios according to compliance and profiling rules.
- Dependency Service Readiness: Upstream APIs, message queues or external systems required by the application under test must be stubbed, mocked or deployed in test mode.
- Feature Flag Configuration: Feature toggles influencing application behavior should be set to the correct state.
- Scheduling Constraints: Concurrency limits, predefined time windows and resource-intensive suite schedules (nightly regressions, weekend load tests) must be defined.
Code and Build Artifact Inputs
- Source Control Reference: Commit hash, branch name or pull request identifier integrated with systems such as GitHub Actions, GitLab CI/CD or Azure DevOps Pipelines.
- Artifact Identifiers: Build numbers, semantic version strings or checksum-based tags ensure precise mapping between code and test executions.
- Container Image Locations: Fully qualified image URLs for containerized tests (for example, registry.company.com/app-under-test:1.2.3-test).
- Executable Packages: Paths to JARs, ZIPs or object-store artifacts (Amazon S3, Azure Blob).
- Build Metadata: Commit author, timestamp and build environment variables drive test selection and dynamic parameters.
Environment and Infrastructure Inputs
- Endpoint URIs: Base URLs for application services, database hosts and message brokers.
- Credentials and Access Tokens: API keys, OAuth tokens or identity provider credentials.
- Network Configuration: VPN settings, SSH tunnels or service mesh parameters.
- Infrastructure Health Indicators: Metrics confirming CPU, memory, storage and network utilization, fed by tools like Datadog or Prometheus.
- Environment Labeling: Tags identifying environment purpose (smoke, regression, performance) to route tests and collect metrics.
Test Suite and Configuration Inputs
- Suite Definitions: Manifests of test classes, scripts or scenarios managed in frameworks such as Selenium Grid, Appium or TestComplete.
- Filter Criteria: Tags, annotations or labels (critical, ui, api, database) selecting test subsets.
- Execution Parameters: Timeouts, retry policies, parallelism settings and device or browser configurations.
- Dynamic Data References: Pointers to datasets or configuration tables for data-driven tests.
- Environment-Specific Overrides: Variable files or configuration maps adjusting behavior per environment.
Data and State Inputs
- Database Snapshots or Seed Scripts: SQL dumps or migration scripts to establish a known data state.
- File System Artifacts: Configuration files, certificates or media assets required by the application.
- Message Queue Data: Preloaded messages simulating real-time events.
- Service Mocks: Virtualized contracts or stubs populated with expected responses.
Trigger Mechanisms
- Continuous Integration Events: Post-commit, merge or pull request events triggering test jobs.
- Scheduled Triggers: Cron-style schedules for nightly regressions and off-peak tests.
- Environment State Changes: Provisioning or data seeding completion events.
- Manual Intervention: On-demand execution via pipeline dashboards or chat-ops commands.
- On-Failure Retries: Conditional re-execution of flaky tests coordinated by tools such as Functionize or Testim.
Scheduling and Orchestration
Core Scheduling Logic
The orchestration layer evaluates triggers, gathers inputs from version control events, environment readiness checks and test metadata, then applies rules to select test suites and allocate execution slots. It integrates commit events from GitHub Actions or GitLab CI/CD, readiness signals from Azure DevOps or Kubernetes clusters, test case metadata and resource availability from platforms such as Selenium Grid or BrowserStack.
The scheduler determines which suites run immediately or queue for later, how many parallel instances to spawn, execution sequence when dependencies exist and fallback paths for readiness failures. These decisions are codified in pipeline definitions or APIs, such as declarative YAML in Jenkins or Kubernetes Job manifests.
Parallelization Strategies
- Test Suite Sharding: Dividing suites into smaller groups by feature or tags.
- Data-Driven Concurrency: Feeding multiple instances of the same script with varied data sets.
- Environment Pooling: Using pools of pre-provisioned containers or VMs to avoid delays.
- Dynamic Scaling: Programmatic integration with auto-scaling services such as AWS ECS or Google Kubernetes Engine to meet peak demand.
Prioritization Mechanisms
- Risk Score: Derived from defect history and code complexity, sourced from tools like SonarQube.
- Business Impact: High-priority tests for revenue-critical or compliance features.
- Dependency Hierarchy: Smoke and integration tests before deeper functional or performance suites.
- Recent Failures: Elevating tests that failed in the last cycle.
Sequencing and Dependencies
Dependency graphs model relationships between test suites, with workflow engines such as Camunda or Jenkins Pipelines executing independent nodes in parallel while deferring dependent nodes until prerequisites succeed.
CI/CD Integration
- Pre-Merge Validation: Automated tests on feature branches via GitHub Actions or GitLab CI/CD.
- Nightly Builds: Full regressions scheduled off-peak, with results fed into dashboards.
- Release Gates: Smoke and performance tests triggered by release candidate tags.
- Environment Cleanup: Post-execution teardown, metrics collection and log archiving.
Coordination and Communication
- Triggering Agents: Webhooks and API calls from source code management systems.
- Provisioning Services: Infrastructure-as-code tools like Terraform or Pulumi reporting status back to the scheduler.
- Test Execution Engines: Frameworks such as JUnit 5, TestNG or Playwright emitting progress via standard formats.
- Reporting Dashboards: Platforms like Kibana or Grafana visualizing pass rates and bottlenecks.
- Stakeholder Notifications: Alerts via Slack or Microsoft Teams on execution status and failures.
Monitoring and Continuous Improvement
- Execution Metrics: Queue lengths, wait times and durations to identify bottlenecks.
- Failure Analysis: Classifying failures by root cause to refine scheduling and resource policies.
- Capacity Forecasting: Historical data-driven predictions for proactive scaling.
- Policy Updates: Adjusting priorities and concurrency limits based on feedback.
- Retrospectives: Regular reviews of orchestration performance and improvement opportunities.
AI-Driven Adaptation and Monitoring
Environment Health Monitoring
AI-powered agents collect telemetry from infrastructure components, test harnesses and the application under test. They use unsupervised learning to establish baselines for CPU, memory, network latency and disk I/O, apply time-series anomaly detection, parse log streams with natural language processing to identify recurring errors and calculate composite health scores for each environment instance. Platforms such as Datadog or custom ML pipelines provide these capabilities.
Dynamic Scheduling Adjustments
- Priority Reordering: Reinforcement learning evaluates test criticality against health scores to sequence runs.
- Parallelization Management: Algorithms optimize concurrency levels per environment to avoid oversubscription.
- Adaptive Batching: Grouping tests with similar dependencies to reduce setup overhead.
- Context-Aware Routing: Directing tests to the healthiest available nodes based on real-time performance and historical success rates.
Anomaly Detection and Self-Healing
- Root Cause Inference: Bayesian networks analyze correlated metrics to identify underlying issues.
- Self-Healing Actions: Playbooks trigger environment resets, cache clears or service restarts on specific anomaly patterns.
- Escalation Decisioning: Failed automated remediations escalate issues to human operators with enriched context.
- Learning from Incidents: Reinforcement loops refine intervention strategies to reduce false positives.
Predictive Resource Scaling
- Demand Forecasting: Time-series models predict queue lengths and peak loads.
- Proactive Provisioning: Triggers infrastructure-as-code modules to spin up resources ahead of demand.
- Cost Optimization: Balancing performance targets and budget constraints by scaling resources based on forecast confidence.
- Workload Smoothing: Shifting scheduled test batches to flatten peaks and avoid overprovisioning.
Intelligent Load Balancing
- Performance Profiling: Supervised models classify nodes by execution speed and stability.
- Load Distribution: Constraint solving assigns test cases to nodes to minimize completion time.
- Dependency Mapping: Graph analytics ensure tests with shared resources or sequences run on compatible nodes in order.
- Resilience Routing: Rerouting in-flight tests to alternate nodes upon node failure.
Feedback Integration
- Outcome Analysis: Classification models assess run outcomes, failure modes and durations.
- Model Retraining: Execution metrics and incident data feed back into scheduling, detection and forecasting models.
- A/B Testing of Policies: Controlled experiments compare scheduling strategies to adopt superior approaches.
- Dashboard Enrichment: Visualizations surface model performance and drift, enabling retraining interventions.
Adaptive Orchestration Outcomes
By embedding intelligence at each decision point—health monitoring, scheduling adjustments, self-healing, predictive scaling and load balancing—teams achieve a resilient, adaptive test execution pipeline. Continuous feedback loops refine AI agents, driving improvements in throughput, reliability and cost efficiency to support fast-paced development cycles without compromising quality.
Execution Artifacts and Feedback
Artifact Portfolio and Structure
Automated test runs produce artifacts that document system behavior, environment state and AI-driven adaptations. Consistent structures, naming conventions and metadata schemas maximize downstream utility. Key artifacts include:
- Test Result Files: Detailed XML (JUnit), JSON or HTML files enumerating each case, status, duration and tags, correlated by build numbers or commit hashes.
- Execution Logs: Standard output, debug traces and framework messages, centralized in platforms like ELK (Elasticsearch, Logstash, Kibana) or Splunk for searchable analysis and AI-driven log pattern recognition.
- Coverage and Quality Reports: Code coverage heatmaps and metrics feeding risk engines to calculate test completeness scores.
- Performance and Resource Metrics: Telemetry on CPU, memory, disk I/O, network latency and application-specific metrics recorded by tools such as New Relic or Dynatrace.
- Environment Snapshots: Identifiers for containers, VMs or cloud instances, orchestration manifests and network topologies for reproducibility and post-mortems.
- AI Adaptation Logs: Records of scheduling decisions, routing changes and scaling events made by AI agents.
A recommended directory layout is:
- Outputs/<pipelineName>/<buildNumber>/results/
- Outputs/<pipelineName>/<buildNumber>/logs/
- Outputs/<pipelineName>/<buildNumber>/coverage/
- Outputs/<pipelineName>/<buildNumber>/telemetry/
- Outputs/<pipelineName>/<buildNumber>/env-snapshot/
- Outputs/<pipelineName>/<buildNumber>/ai-adaptation/
Dependencies and Contextual Requirements
- Versioned Test Definitions: Test scripts maintained alongside application code or in dedicated repositories to avoid mismatches.
- Test Data Availability: Validated datasets conforming to expected schemas and compliance rules.
- Configuration Consistency: IaC templates and runtime configurations synchronized to prevent drift.
- Pipeline Context: CI/CD variables (branch, PR ID, commit SHA) linking results to source changes.
- AI Parameterization: Thresholds, alerting rules and baselines stored in configuration registries.
- Access Control: Ephemeral credentials and role-based permissions for artifact upload and service calls.
Handoff to Defect Analysis
- Webhooks: CI/CD platforms post JSON payloads on completion, triggering automated anomaly scanning.
- Artifact Repositories: Storing outputs in Amazon S3, Azure Blob or Nexus with event notifications for log ingestion.
- Streaming Architectures: Emitting test events to Apache Kafka, AWS Kinesis or RabbitMQ for real-time processing.
- API Callbacks: Summaries posted directly to issue trackers like Jira via RESTful calls.
- Collaboration Channels: Notifications in Slack or Microsoft Teams with links to logs and dashboards.
Reporting and Stakeholder Communication
- Engineering Dashboards: Grafana, Kibana or Datadog visualizing throughput, failure rates and anomaly scores.
- QA and Release Reports: BI platforms (Tableau, Power BI) generating interactive coverage and trend reports.
- Executive Summaries: Release readiness scores, risk heatmaps and compliance status in portals or slide decks.
- Documentation Wikis: Confluence or SharePoint pages embedding live widgets and post-mortem analyses.
Continuous Improvement Feedback Loop
- Defect Classification: AI-driven tagging of failures by severity and root cause, informing test generation.
- Flakiness Detection: Identifying intermittent failures to quarantine or remediate unstable tests.
- Environment Optimization: Right-sizing templates based on utilization metrics and predictive scaling outcomes.
- Model Retraining: Automated pipelines retraining scheduling and detection models with labeled execution data.
- Process Backlog: Execution metrics and defect patterns driving improvement initiatives and retrospectives.
- Governance and Audit Trails: Comprehensive logs of AI decisions and remediation actions for compliance and accountability.
Treating execution results as dynamic inputs enables a self-improving, fully orchestrated testing ecosystem that continually adapts to application changes and organizational needs.
Chapter 7: AI-Based Defect Detection and Classification
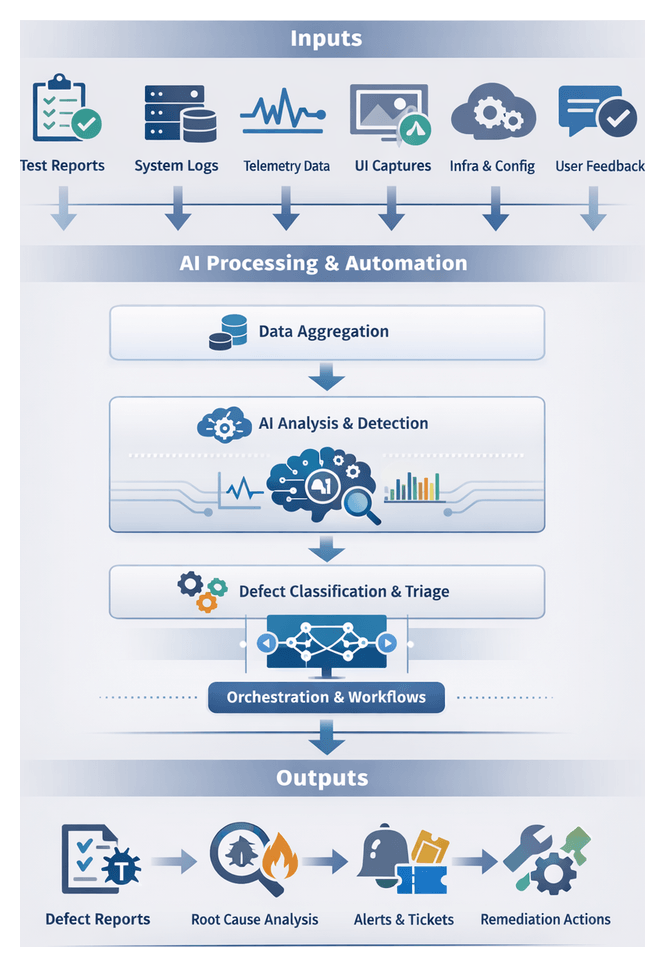
Stage Purpose and Objectives
This stage establishes a foundation for AI-driven defect detection and classification within complex software delivery pipelines. By aggregating diverse input sources—test execution reports, logs, telemetry, visual artifacts, infrastructure data, configuration metadata, and user feedback—organizations equip AI agents with comprehensive, reliable information. This enables proactive anomaly detection, accurate defect categorization, and data-rich root-cause analysis, accelerating the identification of issues and streamlining resolution workflows.
AI-Driven Input Categories
- Test Execution Reports: Sources include Jenkins, GitLab CI, Selenium, Cucumber, and Appium. Reports in XML, JSON, or HTML capture pass-fail outcomes, assertion failures, error messages, and timings. AI agents parse these to flag failures, correlate patterns, and prioritize defects by recurrence and business impact.
- Application and System Logs: Ingested from platforms such as Elastic Stack, Loggly, Datadog, Splunk, and New Relic. Logs record runtime events, exception traces, and resource warnings. Natural language processing and pattern-matching detect silent failures, parse stack traces, and group related events into defect candidates.
- Performance and Telemetry Metrics: Collected via Dynatrace, New Relic, AWS CloudWatch, and Prometheus. Data streams include CPU, memory, response times, throughput, and database latencies. AI agents establish baselines, detect regressions, and correlate metrics with functional failures to assess severity.
- UI Artifacts and Screenshots: Captured by frameworks like Selenium, Playwright, and session replay tools such as FullStory and Hotjar. Visual analysis and OCR identify layout shifts, rendering errors, and missing elements, distinguishing presentation defects from functional errors.
- Network and Infrastructure Data: Sourced from SolarWinds, Datadog, Kubernetes, and Docker. Latency, packet loss, DNS errors, and orchestration events reveal connectivity issues and misconfigurations that contribute to performance or functional defects.
- Configuration and Environment Metadata: Retrieved from Terraform, Puppet, etcd, and Consul. Version mismatches, drift, and environment variables are correlated with defect occurrences, enabling AI agents to recommend remediation steps.
- User Feedback and Support Tickets: Extracted from systems like Jira, GitHub Issues, Zendesk, and Freshdesk. Natural language processing classifies feedback, extracts reproduction steps, and links user-reported issues to system-generated inputs for prioritization based on impact.
Infrastructure Prerequisites and Data Governance
To ensure data integrity and availability, organizations must implement:
- Instrumentation Standards—Unified logging formats (e.g., JSON), consistent naming conventions, and contextual identifiers (request and session IDs).
- Centralized Data Pipelines—High-throughput message queues (for example Apache Kafka), secure logging and monitoring solutions with retention policies.
- Environment Consistency—Infrastructure-as-code templates, synchronized test data versions, automated health checks to validate environment readiness.
- Artifact Integration—APIs or webhooks for streaming reports and tickets, metadata-tagged screenshot storage, and data lake repositories for reports.
- Data Governance—Access controls, auditing mechanisms, anonymization or masking for GDPR/HIPAA compliance, and defined retention schedules.
- Baseline Metrics—Historical defect baselines, success metrics (detection accuracy, classification precision, false positives), and continuous ground truth collection via manual triage.
Structured Automation Workflow
A high-level automation lifecycle divides activities into distinct stages, each with defined inputs, actions, and outputs. A typical sequence includes:
- Requirements Integration and Traceability
- Test Case Generation (model-based, record-and-replay, or AI-driven)
- Infrastructure and Environment Provisioning
- Synthetic Test Data Management
- Test Execution and Scheduling
- Defect Detection and Classification
- Defect Triage and Prioritization
- Result Analysis and Predictive Insights
- Feedback Loop and Model Refinement
Between stages, transitions guard quality gates, trigger notifications, and ensure artifact handoffs maintain context and compliance.
Orchestration and Team Coordination
The orchestration layer coordinates tools, distributes work, and tracks state changes in real time. Core capabilities include:
- Unified API Contracts—Standardized endpoints and payload schemas for seamless data exchange across requirement, test design, and CI/CD platforms.
- Event-Driven Triggers—Webhooks, message queues, or publish-subscribe patterns to initiate downstream actions immediately.
- State Management—Central registries or workflow engines recording execution history, artifact versions, and decision outcomes for auditability.
- Error Handling and Retry Logic—Idempotent tasks with automatic retries, fallback paths, and alerting to minimize manual intervention.
- Scalability Mechanisms—Dynamic scaling of agents and environments based on workload metrics and predictive allocation.
Popular orchestration solutions include Jenkins, GitLab CI, and Azure DevOps Pipelines. Roles aligned to this workflow ensure accountability:
- Business Analysts and Product Owners—Validate requirements and acceptance criteria.
- Test Architects—Design automation strategy and select frameworks like Selenium or Playwright.
- DevOps Engineers—Implement infrastructure-as-code and integrate orchestration pipelines.
- AI Engineers—Develop and maintain machine learning models for detection, classification, and capacity planning.
- QA Engineers—Monitor pipeline health, analyze failures, and refine scripts based on AI insights.
- Release Managers—Define rollout strategies, enforce quality gates, and coordinate cross-team communication.
Machine Learning Pipeline for Defect Analysis
AI models transform raw test outputs into actionable insights. Integrating supervised, unsupervised, and deep learning approaches enables comprehensive defect triage with real-time inference and continuous improvement.
Data Preparation and Feature Engineering
Data ingestion services from Splunk or the ELK Stack feed logs, telemetry, error messages, screenshots, and test metadata into feature stores. Cleaning modules normalize timestamps, remove noise, and mask sensitive information. Transformation functions tokenize text, generate embeddings, and vectorize images via convolutional neural networks, ensuring scalable feature generation with traceability.
Supervised Learning Architectures
Models trained on labeled defect data predict critical attributes. Common architectures:
- Gradient boosting machines (e.g., XGBoost) for structured features
- Random forests for robustness and feature importance
- Multilayer perceptrons combining numerical and textual embeddings
- LSTM sequence models analyzing time-series events
Platforms such as Amazon SageMaker, Microsoft Azure Machine Learning, and DataRobot provide automated pipelines for hyperparameter tuning, model evaluation, and version management. Supervised models classify severity, predict root-cause categories, assign component tags, and estimate resolution times.
Unsupervised and Hybrid Anomaly Detection
To detect novel defects, unsupervised methods flag anomalies:
- Clustering (DBSCAN, K-means) to group failures and highlight outliers
- Autoencoders for reconstruction error anomaly scoring
- Gaussian mixture models modeling data distributions
Hybrid pipelines relabel human-reviewed anomalies into supervised datasets. Tools like H2O.ai and Google Cloud AI Platform support automated retraining and scalable inference, reducing manual triage effort and detecting zero-day failures.
Deep Learning for Visual and Textual Data
Deep networks extract insights from unstructured data:
- Convolutional neural networks detect UI anomalies from screenshots
- Transformer-based models (e.g., BERT) interpret error messages and stack traces
- Multimodal architectures correlate visual and textual embeddings
The Splunk Machine Learning Toolkit, PyTorch, and TensorFlow integrate these models into inference services. Roles include screenshot validation, error entity extraction, and enhanced classification accuracy when combined with structured features.
Deliverables and Integration
The defect detection and classification stage produces structured artifacts that bridge raw outputs and actionable insights:
- Defect Reports—JSON objects or database records with unique IDs, timestamps, test case references, detailed descriptions, severity labels, priority scores, and AI agent confidence values.
- Root Cause Hypotheses—Ranked by confidence with supporting evidence (stack traces, log excerpts, metrics).
- Contextual Telemetry Links—References to correlated streams in Splunk or the Elastic Stack.
- Visual Evidence—Screenshots, video recordings, and UI snapshots linked from object storage such as Amazon S3.
- Traceability Links—Bidirectional mappings to test cases, requirements, commits, and pull requests.
- Enriched Metadata—Technical metadata (environment IDs, OS versions), code lineage data, execution context, error classification tags, dependency references, and compliance flags.
Consistency is ensured through JSON Schema validation, relational tables in PostgreSQL or MySQL, time-series stores like InfluxDB, Kafka event streams, and Elasticsearch indices for search. Artifact repositories archive visual and log bundles with secure access links.
Integration Points and Handoff Processes
Automated delivery of enriched defect records to engineering platforms closes the loop between detection and resolution:
- Jira Integration—REST API calls create or update issues in Jira with custom fields for AI-generated attributes.
- ServiceNow—Incidents or change requests in ServiceNow link to telemetry dashboards and log attachments.
- GitHub Issues—Programmatic creation of issues in GitHub Issues with labels and milestones.
- Azure Boards—Work items in Azure DevOps trace back to test plans and pipelines.
- Webhook Notifications—Real-time alerts via Slack, Microsoft Teams, or email with summary cards and deep links.
The AI orchestration layer manages authentication, retry logic, and error handling to ensure reliable delivery.
Defect Triage, Prioritization, and Traceability
Once defects are integrated, event-driven triggers and AI-powered routing accelerate handoff to triage workflows:
- Event-Driven Triggers—Message queues or webhooks initiate triage engines or RPA bots.
- AI-Powered Routing—Models assign defects to teams or individuals based on skills, workload, and historical performance.
- Priority Scoring—Composite scores blend business impact, customer usage metrics, and technical severity.
- Automated Notifications—Personalized alerts outline defect details, recommended actions, and SLA timelines.
- Escalation Policies—Critical defects bypass queues, triggering executive alerts or support calls.
Downstream systems update test management tools (TestRail, Zephyr), requirements platforms (Jama Connect), CI/CD pipelines, analytics dashboards (Tableau, Power BI), and AI retraining pipelines with resolution feedback. Unique identifiers and comprehensive metadata maintain end-to-end traceability across the testing lifecycle.
Chapter 8: Defect Triage and Dynamic Prioritization
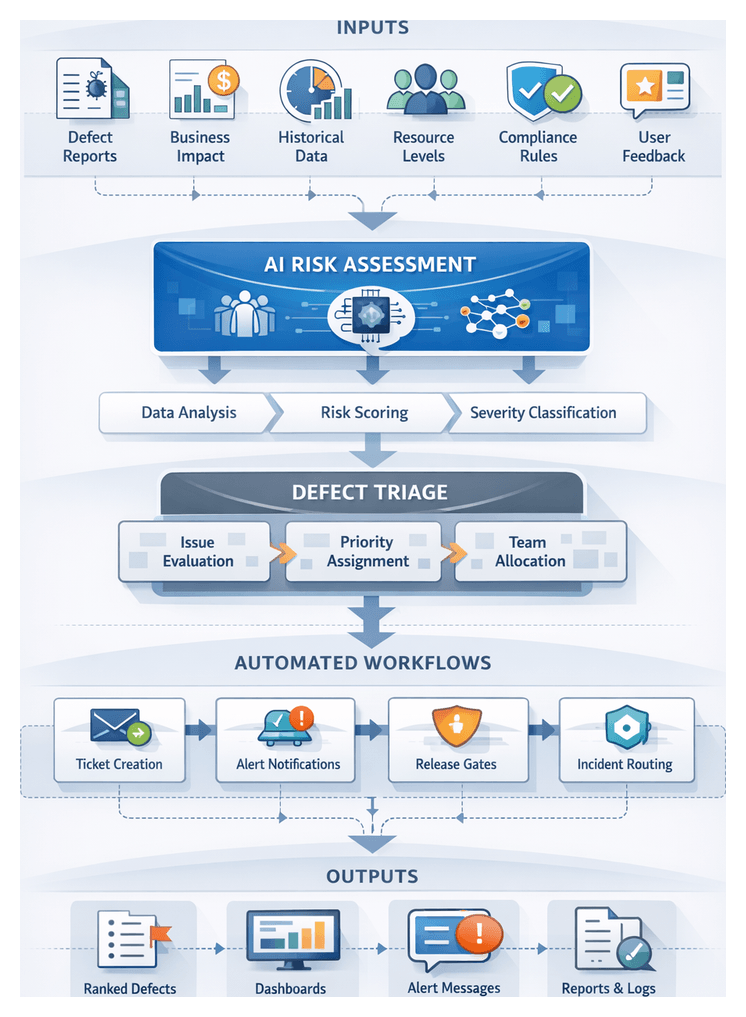
Context for Structured Automation Workflows
In today’s fast-paced software landscape, teams must deliver features rapidly while maintaining reliability at scale. Traditional testing approaches, reliant on manual handoffs and siloed tools, struggle with modern architectures such as microservices, cloud-native deployments, and continuous integration and delivery (CI/CD) pipelines. A structured automation workflow serves as the backbone for integrating diverse systems, embedding intelligence at every stage, and preventing quality gates from becoming bottlenecks. Platforms like Jenkins for CI, Terraform for infrastructure provisioning, Testim for AI-driven test authoring, and Applitools for visual validation illustrate the specialized capabilities that must be orchestrated seamlessly.
Such workflows coordinate requirement ingestion, test design, environment provisioning, data generation, execution, analysis, and feedback. By defining clear inputs, outputs, and decision points, organizations achieve fast, reliable testing cycles that align with agile and DevOps practices. This section examines the critical defect triage and dynamic prioritization stage within a comprehensive automation workflow, highlighting the AI-driven tools, data inputs, models, outputs, and handoff mechanisms that transform raw defect data into actionable insights.
The defect triage and dynamic prioritization stage bridges automated detection and timely resolution. AI-driven agents enrich raw defect reports with severity predictions, root-cause tags, stack traces, screenshots, and telemetry snapshots. These records are evaluated against business impact, risk thresholds, and team capacity to assign appropriate priority levels, route issues to the right teams, and schedule remediation in line with release goals and compliance constraints.
By standardizing and automating this stage, teams reduce noise in the backlog, accelerate resolution of high-risk issues, and maintain strategic alignment with quality objectives. Core to this process is an objective, AI-informed risk assessment that adapts to evolving code dependencies, user behavior, and operational telemetry.
Key Inputs
- Defect Reports and Metadata: Enriched records from test frameworks and logging systems, each with unique identifiers, classification labels, timestamps, stack traces, screenshots, and links to code commits.
- Business Impact Parameters: Quantified costs of failure, user experience degradation, revenue loss, and regulatory exposure derived from SLAs, compliance rules, customer usage analytics, and domain risk models.
- Historical Metrics: Data on past defects, resolution times, reopen rates, and post-release escapes pulled from Atlassian Jira and ServiceNow to inform expected remediation effort and risk exposure.
- Resource Availability: Real-time team workloads, sprint allocations, planned leave, and skill matrices from project management and workforce systems to balance defect assignments.
- Regulatory Constraints: Compliance requirements such as GDPR, HIPAA, or ISO 26262 that trigger expedited escalation for defects affecting sensitive or safety-critical functions.
- Customer Feedback: Production telemetry, user-reported incidents, and support tickets integrated from service platforms to reflect real-world impact.
- Release Schedules: Feature freeze dates, code-lock windows, and milestone deadlines that elevate priority for defects detected in late-stage builds.
- AI-Driven Risk Scores: Predictive risk models assign scores based on change complexity, code ownership, defect density, and past failure rates to augment manual severity assessments.
Prerequisites and Conditions
- Stable Classification Outputs: AI agents delivering consistently formatted, accurately classified defect records with severity and root-cause predictions meeting defined accuracy thresholds.
- Severity-Priority Matrix: A clear mapping of severity levels (Critical, High, Medium, Low) to priority categories (P0–P3) aligned with business risk tolerance and SLAs.
- Integrated Toolchain: API connections between test management, defect tracking, CI/CD, and project planning platforms to enable real-time data exchange.
- Business Context Repository: A centralized source of truth for impact parameters, compliance rules, and release milestones that automatically updates triage models when strategic or regulatory requirements change.
- Resource Profiles: Up-to-date information on team expertise, certifications, and capacity to guide routing logic.
- Data Quality Processes: Regular audits and cleansing routines to address duplicates, incomplete records, and misclassifications in defect data.
- Governance Policies: Codified rules for defect escalation, approvals, and stakeholder involvement accessible to the triage workflow.
- Model Monitoring: Mechanisms to validate AI risk assessment models against actual defect outcomes and trigger retraining when performance drifts.
AI-Driven Risk Assessment
AI-driven risk assessment elevates defect triage from static severity matrices to adaptive, context-aware prioritization. By ingesting real-time data and applying machine learning, these functions highlight defects posing the greatest threat to stability, security, and user satisfaction.
Data Gathering and Feature Extraction
- Issue Tracker Metadata: Component, reporter, linked test cases, historical resolution times
- Source Code Metrics: Recent commits, complexity measures, code ownership details
- Operational Telemetry: Performance anomalies and error rates captured by Splunk
- Test Results: Pass/fail trends, flakiness indicators, coverage gaps from CI/CD dashboards
- User Feedback: Sentiment analysis on support tickets and user comments
Natural language processing tokenizes descriptions, static analysis derives dependency graphs, and time-series processing converts telemetry into trend features. These multi-modal attributes feed predictive risk models.
Predictive Modeling and Real-Time Scoring
Models—such as gradient boosting, random forests, graph neural networks, and anomaly detection ensembles—are developed on platforms like Databricks and tracked with MLflow. Feature stores ensure consistency between training and inference, while automated hyperparameter tuning refines model performance.
In real-time inference, microservice-deployed AI agents respond to defect creation or updates—often via webhooks from Jira—by refreshing features and computing risk scores. Scores map to priority levels based on configurable thresholds, with dynamic reprioritization as new data arrives. Dashboards powered by Grafana visualize evolving risk trends.
Continuous Learning and Lifecycle Management
- Performance Monitoring: Tracking prediction accuracy and calibration drift
- Feedback Ingestion: Labeling resolved defects with actual incident outcomes
- Model Registry: Versioned storage of model artifacts and training datasets
- Canary Deployments: Phased rollout of updated models to compare real-world performance
Platforms such as Seldon and Kubeflow orchestrate retraining pipelines, ensuring risk models evolve with the application and its operational environment.
Outputs and Handoff Mechanisms
The dynamic prioritization stage produces actionable artifacts and automated handoffs that guide development, support, and release teams.
Produced Artifacts
- Ranked Defect Repository: A centralized dataset ordered by composite risk scores, stored in Jira.
- Defect Prioritization Dashboard: Interactive visualizations of top issues, risk score trends, and filters by module or team, implemented via ServiceNow or enterprise BI engines.
- Notification Payloads: Structured messages for Slack or Microsoft Teams containing defect IDs, priority levels, and deadlines.
- API Endpoints and Webhooks: RESTful interfaces exposing prioritized lists for CI/CD pipelines and release orchestration tools like Jenkins or Azure DevOps.
- Handoff Summary Reports: PDF or HTML documents detailing prioritization rationale, model confidence, and recommended next steps for governance reviews.
Underlying Dependencies
- Defect Classification Results with root-cause and severity tags
- Risk Assessment Engine Outputs quantifying impact, regulatory exposure, and technical debt
- Historical Resolution Metrics feeding predictive calibration
- Team Capacity Profiles from resource planning or DataRobot Applied Intelligence
- Compliance Constraints surfaced via policy-as-code
- Integration Configurations for external systems managed in code repositories
Automated Handoff Mechanisms
- Issue Creation: Webhooks or API calls generate tickets in Jira, GitHub Issues, or Azure Boards with contextual metadata and priority labels.
- Release Gate Integration: Priority thresholds enforced in deployment pipelines—triggering blockers in Jenkins or GitLab CI when critical defects are unresolved.
- ChatOps Notifications: Real-time postings to Slack or Teams channels with links to dashboards and call-to-action buttons.
- Stakeholder Email Briefs: Scheduled or event-driven emails to product owners and QA leads listing top-N defects and recommended timelines.
- Governance Dashboard Updates: Streaming ETL processes refresh executive views of backlog health and release readiness.
- Incident Management Integration: Automatic creation of tickets in ServiceNow for critical production defects, linking back to test logs for rapid investigation.
Verification and Traceability
- Acknowledgment Signals: Webhook responses from Jira confirm successful ticket creation and assignment.
- Heartbeat Monitoring: Periodic checks validate webhook connectivity and API health.
- Stakeholder Confirmations: Acknowledgment workflows in email or chat ensure tasks are claimed within SLAs.
- Unique Defect IDs: Globally unique identifiers maintained across all artifacts and logs.
- Cross-Reference Links: Embedded URLs to test cases, telemetry snapshots, and model versions for root-cause analysis.
- Immutable Audit Logs: Append-only records of every handoff event timestamped by the orchestrator.
- Versioned Reports: Change summaries in handoff documents preserve historical prioritization context.
Best Practices and Scaling Considerations
Delivering prioritized defect outputs effectively requires clear, role-tailored communication and robust scaling strategies.
- Role-Based Messaging: Executives receive high-level dashboards, developers get detailed issue lists, and product managers view risk assessments.
- Actionable Language: Use concise descriptions with explicit “Next Steps,” assigned owners, effort estimates, and due dates.
- Trend Visualizations: Heat maps and charts illustrate defect influx, resolution velocity, and impacted modules.
- Consistent Cadence: Align notifications with sprint planning, stand-ups, and release milestones to synchronize decision-making.
- Feedback Loops: Enable recipients to flag anomalies or request clarifications via chat threads or issue tracker comments.
Example Handoff Workflow
In an overnight regression run for an e-commerce platform, AI triage identifies 150 defects, 30 exceeding Severity 2. At 07:15 the orchestrator uses Jira’s /api/issues/bulk-create endpoint to tag these as P1–P3. Simultaneously, a JSON payload posts to the “#regression-priorities” Slack channel with defect keys, titles, and risk scores. At 07:20 an email brief attaches a PDF summary and dashboard link to the release manager and product owner. By 07:30, ServiceNow logs security defects as incident tickets, alerting the SOC. Developers acknowledge Jira tickets by 08:00, triggering an audit log entry for each acknowledgment.
Scaling Handoff Processes
- Idempotent Operations: Ensure retries do not create duplicate tickets or notifications.
- Rate Limiting: Batch handoffs to respect external API thresholds and avoid throttling.
- Error Handling: Implement exponential backoff and alert on failed handoff attempts.
- Monitoring: Track handoff latency, success rates, and errors in an AI operations dashboard.
- Configuration as Code: Version-control mappings, endpoint definitions, and templates for collaborative change management.
Chapter 9: Result Analysis and Predictive Quality Insights
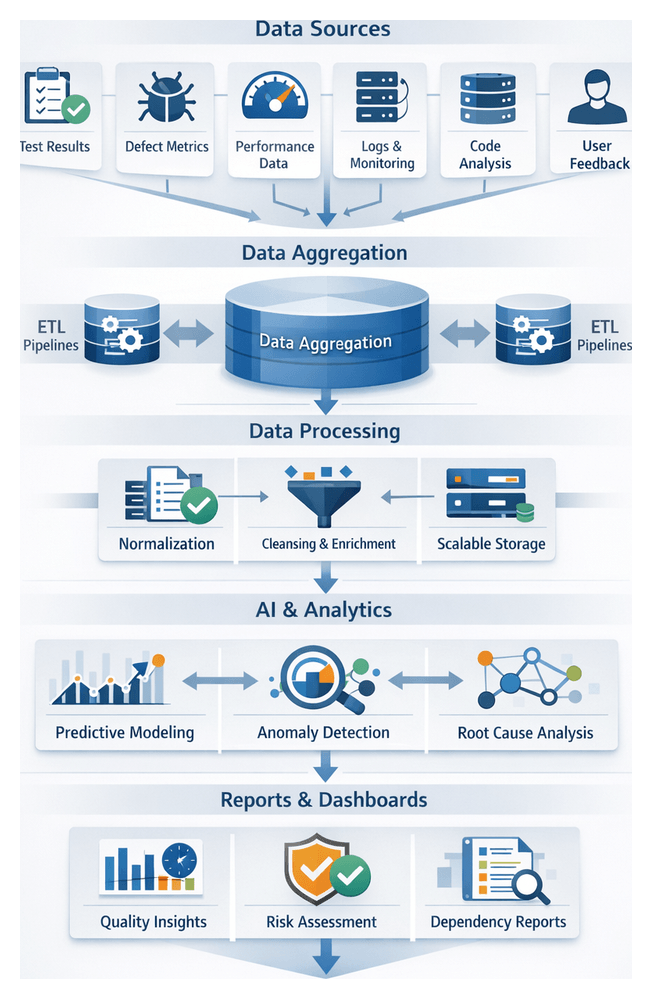
Analysis Inputs and Data Aggregation
The Analysis Inputs and Data Aggregation stage establishes a unified foundation for AI-driven quality analytics by collecting, standardizing, and preparing data from testing and operational sources. This comprehensive dataset underpins predictive modeling, defect forecasting, and release readiness assessments, ensuring that data quality, completeness, and consistency meet stringent analytical requirements.
- Consistency: Harmonize diverse formats from automation tools, defect trackers, and monitoring platforms to prevent misinterpretation.
- Completeness: Aggregate pass/fail rates, defect metrics, performance telemetry, code coverage, and user feedback to capture all quality signals.
- Traceability: Maintain links between raw data and derived metrics to support auditability and root cause analysis.
- Scalability: Automate pipelines to handle growing data volumes without manual intervention.
- Predictive Accuracy: Supply AI models with high-quality, unbiased datasets to improve defect hotspot forecasts and release risk scoring.
Key Data Inputs
- Test Execution Results from automated suites (unit, integration, regression), including pass/fail status, error messages, stack traces, and timestamps. Tools: Jenkins, GitLab CI/CD, Azure Pipelines.
- Defect and Issue Metrics from trackers such as JIRA and TestRail, including counts, severity, resolution times, and test-case linkage.
- Performance and Load Data covering response times, throughput, error rates, and resource utilization. Tools: Grafana, Datadog, New Relic.
- System and Application Logs centralized via Splunk or the Elastic Stack to index runtime events, exceptions, and integration failures.
- Code Quality and Coverage Reports from static analysis tools like SonarQube, detailing code smells, complexity metrics, duplicates, and coverage percentages.
- Environment Health Metrics monitoring CPU, memory, disk I/O, and network latency from cloud and container platforms.
- User Feedback and Telemetry including session traces, support tickets, and post-release monitoring data to inform retrospectives and predictive models.
- Requirement and Traceability Records linking test artifacts to user stories and acceptance criteria in requirement management platforms.
Prerequisites and Pipeline Requirements
- Integrated Logging Frameworks forwarding logs and metrics to Splunk or the Elastic Stack in a consistent schema.
- CI/CD Integration to trigger automated tests and environment health checks via Jenkins, GitLab CI/CD, or Azure Pipelines, publishing results to a central store.
- Data Standardization enforcing common schemas for test results, defect entries, and performance records, with validation to catch anomalies.
- Secure, Scalable Storage in data lakes or time-series databases with partitioning and retention policies.
- Access Controls and Governance ensuring role-based access, privacy compliance, and audit logging across the pipeline.
- Correlation Keys embedding unique identifiers in test cases, deployment jobs, and application instances for accurate data joins.
- Historical Archives retaining past test cycles and defect trends to support AI model training and drift analysis.
- Latency and Freshness defining acceptable delays between data generation and availability for near-real-time analytics.
Aggregation and Storage
- Ingestion Automation through ETL/ELT pipelines using Apache NiFi, AWS Glue, or Azure Data Factory to move data into analytical repositories.
- Transformations and Enrichment normalizing timestamps, parsing log fields, and tagging records with metadata like environment and release version.
- Deduplication and Noise Filtering removing redundant events and irrelevant telemetry to enhance signal quality.
- Data Quality Checks validating completeness, consistency, and range conformity, with alerts on degradation.
- Multi-Dimensional Modeling structuring data into fact and dimension tables or time-series collections for efficient querying.
- Cataloging and Metadata Management documenting datasets, lineage, and usage guidelines in a data catalog.
- Scalable Query Infrastructure leveraging platforms like Snowflake, BigQuery, or Apache Druid to power interactive dashboards and AI preprocessors.
Insight Extraction Workflow
The Insight Extraction Workflow transforms aggregated data into actionable quality indicators via coordinated orchestration, analytics services, AI agents, and visualization tools. This end-to-end sequence ensures timely delivery of predictive insights to inform release and testing strategy decisions.
Data Ingestion and Normalization
Orchestration engines such as Apache Airflow or Kubeflow schedule extraction jobs that collect data from CI/CD pipelines, test frameworks, defect trackers, and performance monitors. Data lands in a staging area—cloud data lake or distributed file system—where ETL scripts reconcile schema differences, resolve naming inconsistencies, and timestamp records. AI-powered profiling agents evaluate completeness and cleanliness, flagging anomalies for review.
Analytical Orchestration and AI Agent Coordination
- Analytical engines like Databricks or Snowflake execute feature extraction, time-series aggregation of pass/fail rates, defect counts, and KPI generation.
- Forecasting agents built on TensorFlow or PyTorch predict future defect hotspots and release readiness scores.
- Anomaly detection agents use autoencoders or clustering algorithms to surface unusual patterns in test durations or failure rates, publishing results via Apache Kafka.
- Metadata catalogs track lineage and ensure repeatability of analytic runs.
System Interactions and Data Flow
- Orchestration engines trigger ETL and analytic pipelines on schedule or event.
- ETL jobs extract, normalize, and publish notifications to a message bus.
- Subscribers invoke model inference in containerized or serverless environments.
- Inference results—readiness probabilities, anomaly scores—are stored in the analytics database.
- Reporting services query the database to update dashboards and deliver alerts.
Human Oversight, Security, and Feedback
- Alerting engines notify quality leads via Slack or Microsoft Teams when thresholds are breached or data quality issues arise.
- Stakeholders investigate, retrigger analyses, or correct data, with each intervention logged for audit.
- Security agents enforce encryption, authentication, and data masking for regulated modules, with compliance checkpoints guarding unauthorized report release.
- Feedback loops update orchestration configurations, trigger model retraining, and refine test design based on insights.
Predictive AI Models and Roles
Predictive AI models convert historical and real-time quality data into forward-looking indicators, identifying risks, hotspots, and root causes to drive proactive quality management.
Forecasting Release Readiness and Trends
- Time-series models (ARIMA, LSTM) forecast pass/fail rates, defect arrival, and build durations.
- Facebook Prophet (Prophet) automates seasonality and holiday effects for release schedules.
- Forecasts integrate into dashboards to guide go/no-go decisions.
Hotspot and Anomaly Detection
- Clustering algorithms (DBSCAN, K-means) group related failures to pinpoint unstable modules.
- Unsupervised detectors (isolation forests, autoencoders) and streaming services like Amazon SageMaker identify deviations during continuous execution.
Root Cause Prediction and Impact Analysis
- Supervised classifiers (random forest, gradient boosting) predict defect cause categories by correlating code changes, test logs, and defect labels.
- Graph neural networks map dependencies among code components and infrastructure to estimate issue impact radii.
- Integrations with SonarQube supply complexity and technical debt metrics.
Explainable AI and Governance
- SHAP and LIME techniques clarify feature contributions, fostering trust in predictions.
- XAI annotations in dashboards support auditability and compliance with decision policies.
CI/CD Integration and Model Operations
- Model training and batch inference run on Kubernetes via Kubeflow.
- RESTful APIs serve real-time inference to test orchestration engines.
- CI/CD tools such as Jenkins and GitLab CI trigger retraining on data drift events.
- Monitoring with Prometheus and Grafana tracks model accuracy and latency.
Roles and Responsibilities
- Data Engineers provision pipelines and ensure data quality.
- Data Scientists perform feature engineering, select algorithms, and validate models.
- DevOps Engineers containerize models and manage infrastructure.
- QA Analysts interpret predictions, direct targeted testing, and report anomalies.
- Product Owners consume readiness scores in planning and release decisions.
Dashboard Outputs and Dependency Reports
Interactive dashboards and comprehensive dependency reports synthesize test results, operational telemetry, and AI-driven insights into consumable formats for stakeholders, ensuring transparency, traceability, and informed decision making.
Key Dashboard Outputs
- Real-Time Quality Overview visualizing pass/fail rates, environment health, and defect spikes via Grafana or Tableau.
- Predictive Trend Analysis showing forecasted defects and test durations in Power BI or Splunk.
- Release Readiness Report combining severity distributions, coverage metrics, and stability scores with gating in Jenkins or Azure Pipelines.
- Defect Hotspot Mapping heat maps of error-prone modules with drill-downs in Qlik.
- Test Coverage and Gap Analysis overlaying requirements and executed tests to identify untested areas.
Comprehensive Dependency Reports
- Data Lineage tracing metrics back to source systems, schema versions, and transformation rules.
- Integration Health monitoring API endpoints, queues, and connectors for failures.
- Model Inventory documenting model versions, training data snapshots, hyperparameters, and validation metrics.
- Configuration Reports listing parameter files, feature flags, and environment variables driving analytics.
- Audit Logs capturing access, modifications, and approvals for compliance.
Upstream System Dependencies
- Version Control repositories feeding commit metadata via webhooks.
- Requirements Platforms such as Jama Connect or IBM DOORS.
- Test Management tools like Zephyr Scale and Micro Focus ALM.
- CI/CD Pipelines in Jenkins, GitLab CI, or Azure DevOps publishing artifacts and logs.
- Monitoring Services (AWS CloudWatch, Azure Monitor) emitting environment telemetry.
- Model Repositories storing machine learning artifacts and lineage metadata.
- Data Warehouses such as Snowflake, BigQuery, or Redshift hosting aggregated datasets.
Mechanisms for Results Handoff
- Automated alerts via Slack or Microsoft Teams with links to dashboards.
- Embedded BI views in JIRA or Azure Boards for contextual access.
- API exports to platforms like Databricks for downstream analysis.
- Scheduled PDF/CSV distributions of reports to steering committees.
- Versioned templates and report definitions stored in Git for reproducibility.
Traceability and Governance
- Assign unique identifiers to all data artifacts and map them across systems.
- Enforce access controls and audit logging on dashboards and data stores.
- Implement schema validation and automated testing of analytics pipelines.
- Conduct periodic cross-functional reviews of dependency reports.
By integrating structured data aggregation, orchestrated insight extraction, predictive AI modeling, and rich dashboarding with detailed dependency reporting, organizations establish a transparent, scalable, and trustworthy AI-driven testing pipeline that continuously improves software quality and delivery confidence.
Chapter 10: Continuous Feedback Loop and AI Model Refinement
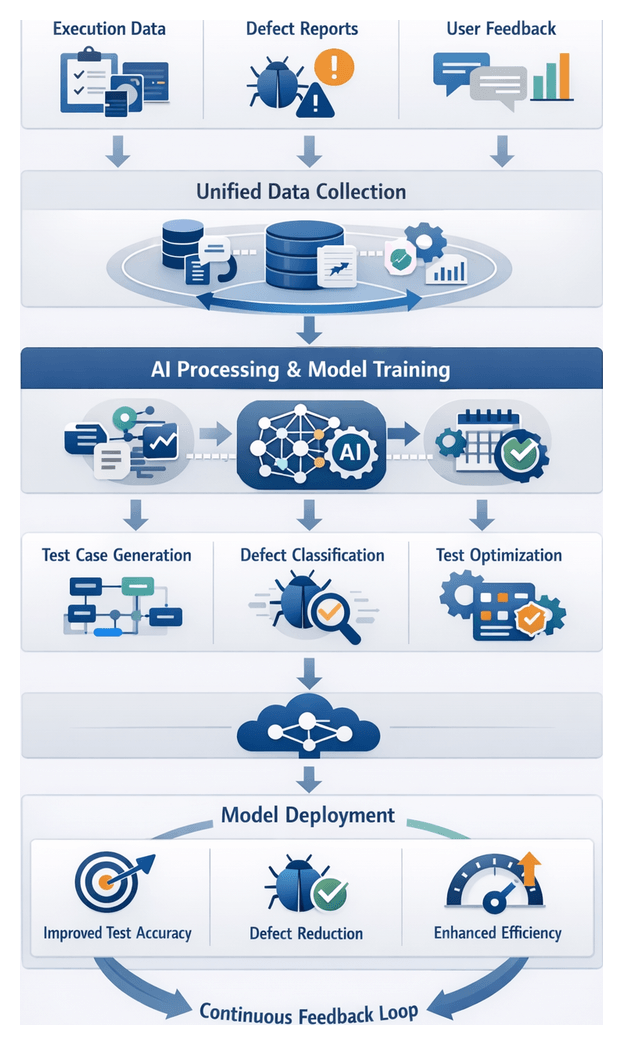
Continuous Feedback for AI-Driven Model Refinement
The continuous feedback loop is the foundation of a resilient, AI-driven testing workflow. By systematically capturing execution results, defect records, and user or operational telemetry, organizations can iteratively improve the models that generate test cases, classify defects, and optimize scheduling. This feedback-driven refinement transforms static automation into a self-optimizing system capable of maintaining quality at scale in fast-paced delivery environments.
Key Feedback Inputs
- Execution Metrics: Pass/fail outcomes, execution duration, and resource utilization from continuous integration tools such as GitLab CI or Azure DevOps; environment telemetry (performance indicators, error rates, system logs) via Prometheus or cloud provider metrics; code and feature coverage analytics; and scheduling data (parallelization efficiency, queue wait times).
- Defect and Incident Data: Issue tracking records—including severity levels and resolution times—from Jira Software or GitLab Issues; contextual metadata such as screenshots, stack traces, and event correlation; root cause analyses by developers or SREs; and historical regression trends revealing flakiness or recurring failure modes.
- User and Operational Feedback: Customer support tickets reporting escaped production issues; post-release telemetry on application performance and errors; and stakeholder surveys capturing qualitative assessments of test coverage relevance and defect prioritization accuracy.
Prerequisites for Effective Feedback Integration
To harness these inputs, organizations must establish robust infrastructure and processes:
- Unified Data Collection: A centralized logging and telemetry framework that aggregates events and metrics from test frameworks, application environments, monitoring tools, and issue trackers into a common data lake or message bus with standardized schemas.
- Versioning and Traceability: Metadata tagging for every test execution and defect record—including code commit identifiers, test suite versions, environment configurations, and AI model versions—to enable precise correlation of outcomes with system states.
- Data Quality and Governance: Policies ensuring completeness, accuracy, and privacy compliance: timestamped logs, enriched defect records, gap-free telemetry streams, and access controls enforced by governance frameworks.
- API and Messaging Integrations: Low-latency pipelines—via REST APIs or message queues (for example, Apache Kafka)—to stream feedback data into model training workflows promptly and reliably.
Conditions for Model Retraining Readiness
Before initiating retraining, specific conditions must be satisfied to ensure meaningful model updates:
- Data completeness thresholds for recent execution and defect samples.
- Active model drift monitoring alerts indicating performance degradation or shifts in feature distributions.
- Provisioned compute resources—GPU or CPU clusters—dedicated to training workflows without impacting production test execution.
- Availability of fresh validation datasets representing new failure modes and edge cases for robust evaluation.
- Pipeline readiness checks, including end-to-end connectivity tests, schema compatibility validation, resource health monitoring, and access control audits.
Retraining and Integration Workflow
The retraining and integration stage ensures that AI components remain accurate and aligned with evolving application behavior. This workflow orchestrates data ingestion, model training, validation, deployment, and monitoring across multiple systems to deliver updated AI models that continuously improve test automation quality.
Data Collection and Preparation
Automated ETL jobs and event-driven collectors extract feedback signals from:
- Test execution repositories: historical logs, performance metrics, pass/fail outcomes, and environment metadata.
- Defect tracking systems: enriched records with classification labels, root cause notes, and resolution statistics.
- User feedback channels: production incident reports, support tickets, and in-product telemetry.
Throughout ingestion, schema validation enforces consistency, anonymization routines protect sensitive data, and versioning in a data registry captures timestamps, transformation scripts, and quality metrics (completeness, uniqueness, conformity).
Retraining Trigger Mechanisms
- Scheduled retraining windows (daily, weekly, monthly) to incorporate fresh data predictably.
- Performance-based triggers when monitoring agents detect declines in model accuracy or drift beyond thresholds.
- Event-driven retraining initiated by major test suite expansions, significant new defect patterns, or application version upgrades.
Model Training Pipeline Orchestration
Orchestration platforms such as Kubeflow and Jenkins coordinate the following stages:
- Feature engineering: transforming raw feedback into normalized, encoded, and aggregated features.
- Training: leveraging GPU or distributed compute clusters with TensorFlow or PyTorch to update model parameters.
- Evaluation: computing metrics (accuracy, precision, recall, F1 score) on hold-out validation sets and real-world test scenarios.
- Comparison: benchmarking new models against production baselines to detect improvements or regressions.
- Artifact packaging: bundling model binaries, weight files, and inference code into versioned artifacts stored in a registry like MLflow.
Parallelism and resource scaling are dynamically managed to optimize training latency and utilization.
Integration with Version Control
All pipeline definitions, training scripts, and configuration files are maintained in Git. Branching strategies isolate experimental work, while pull requests with code reviews by ML engineers and QA specialists enforce quality before merging into the mainline.
Validation and Quality Gates
Before deployment, models must pass rigorous checks:
- Statistical validation against performance thresholds compared to the baseline.
- Scenario testing on edge conditions and stress cases derived from production incidents.
- Shadow testing: routing live inference requests in parallel to both existing and candidate models without impacting production decisions.
- Stakeholder review by test automation leads, ML engineers, and product owners to secure final sign-off.
Failure at any gate halts progression and generates detailed diagnostic reports for rapid remediation.
Deployment Strategies and Handoffs
Validated models are deployed using controlled strategies:
- Canary deployment to a subset of inference servers for behavior monitoring under real-world load.
- Blue-green deployment enabling traffic switch once stability and performance criteria are met.
- Automated rollback plans to revert to the previous model if anomalies are detected post-deployment.
Integration handoffs with downstream consumers—such as test case generators, defect triage engines, and quality dashboards—are managed via documented API contracts, input/output schemas, and version identifiers.
Monitoring and Continuous Improvement
Post-deployment monitoring ensures ongoing model health:
- Inference logging captures inputs, outputs, and confidence scores for every prediction.
- Drift detection analyzes real-time feature distributions and output patterns to surface deviations.
- Alerting thresholds and anomaly detectors notify MLOps teams of performance degradation or unusual behavior.
- Dashboards in Grafana or proprietary analytics modules visualize latency, error rates, and resource utilization.
These insights feed back into the data collection phase, closing the loop and triggering subsequent retraining cycles for continuous adaptation.
Cross-Functional Coordination
- Data engineering teams maintain ETL pipelines and enforce data quality controls.
- Machine learning engineers design model architectures, training scripts, and evaluation protocols.
- Test automation leads define critical validation scenarios and participate in gate reviews.
- DevOps and MLOps specialists configure delivery pipelines, manage infrastructure, and execute deployment strategies.
- Product owners and QA managers review performance dashboards, approve releases, and prioritize retraining triggers based on business impact.
Positioning AI Agents in the Testing Lifecycle
AI agents embedded throughout the testing workflow augment human expertise, automate repetitive tasks, detect anomalies, and adapt test strategies based on real-time analytics. Seamless integration with requirement management, orchestration engines, infrastructure-as-code, synthetic data platforms, and ML lifecycle managers binds these agents into a unified, adaptive process.
Rationale for AI-Driven Augmentation
Manual handoffs between analysts, designers, engineers, and reporting teams introduce delays and risk. Strategically positioned AI agents can:
- Automate repetitive design and execution tasks.
- Detect patterns and anomalies beyond human capability.
- Continuously adjust strategies based on predictive analytics.
- Maintain end-to-end traceability via intelligent orchestration.
- Scale throughput without proportional increases in headcount.
Integrating AI Agents with Supporting Systems
- Requirement management tools such as Jira or Microsoft Azure DevOps for user story ingestion.
- Test orchestration platforms like Mabl and Testim embedding AI-driven design and execution.
- Infrastructure-as-code frameworks (Terraform, Kubernetes operators) for environment provisioning.
- Synthetic data and privacy engines from Tonic.ai or DataGov.
- Analytics dashboards and lifecycle managers like MLflow or Databricks for model tracking and retraining.
Key AI Agent Roles by Workflow Stage
Requirements Analysis and Test Input Generation
Natural language processing agents—leveraging OpenAI models—extract entities and expected outcomes from user stories in Jira or Confluence. They generate structured test inputs, traceability matrices, and flag ambiguities to analysts via Slack or Microsoft Teams.
AI-Powered Test Case Generation
Generative agents such as GitHub Copilot scan code repositories and documentation to produce state-transition diagrams, boundary conditions, and negative scenarios. Supervised classifiers prioritize cases by risk impact and historical defect density, exporting definitions for Selenium, Cypress, or proprietary frameworks.
Environment Provisioning and Capacity Planning
Predictive analytics agents—including AWS CodeGuru—forecast resource demand from AWS, Azure, GCP, or on-prem clusters. They trigger Terraform or Pulumi workflows to provision containers or VMs ahead of test windows and adjust allocations in real time.
Synthetic Test Data Creation and Management
Profiling agents identify key distributions and compliance constraints in production datasets. Synthetic data platforms from Tonic.ai and DataGov generate privacy-preserving records. Validation routines check uniqueness, integrity, and value ranges before injecting data into test environments.
Automated Test Execution and Dynamic Scheduling
Orchestration engines in GitLab CI, Azure Pipelines, and Jenkins enlist AI agents to balance test suites across resources, monitor execution telemetry, retry failures, and reallocate tasks automatically, maximizing throughput and reducing cycle times.
Defect Detection and Classification
Anomaly detection models analyze logs, screenshots, video captures, and telemetry using convolutional neural networks and clustering algorithms. They classify defects by severity and root cause, enriching Jira or Azure Boards with metadata and similarity scores to prioritize triage.
Defect Triage and Dynamic Prioritization
Risk assessment engines—trained on historical release data and business metrics—assign priorities, route issues to specialized teams, and update dashboards with critical clusters. Continuous updates reflect new code changes and emerging defects during release candidate cycles.
Result Analysis and Predictive Quality Insights
Time-series forecasting models ingest test metrics, defect rates, environment health, and timelines to surface hotspots, predict delays, and simulate release scenarios. BI platforms like Tableau or Power BI generate executive summaries, risk heat maps, and go/no-go recommendations.
Continuous Feedback Loop and Model Refinement
Post-release analytics and production incidents feed new datasets into ML pipelines. Retraining workflows—tracked in MLflow or Databricks—update test generation, classification, and scheduling agents. Refined models are deployed with version control, rollback capabilities, and monitoring, ensuring alignment with evolving objectives.
Model Artifacts, Handoffs, and Governance
Deliverables and Versioned Artifacts
Each retraining cycle produces:
- Serialized model binaries (ONNX, Pickle) and inference code.
- Evaluation reports with metrics (accuracy, precision, recall, F1 score, AUC).
- Training metadata: hyperparameters, dataset versions, augmentation details, compute environment, random seeds.
- Drift analysis summaries comparing data distributions across versions.
- Lineage records in a registry such as MLflow or Kubeflow Pipelines.
Dependency Mapping and Impact Analysis
A dependency matrix documents:
- Data schemas and preprocessing scripts transforming raw feedback into training inputs.
- Feature engineering pipelines (code modules, notebooks) for normalization and embedding logic.
- Compute infrastructure specifications (Dockerfiles, Conda environments) ensuring consistency.
- Integration contracts: API schemas and versioned SDKs for model inference.
An impact analysis report assesses sensitivity, worst-case scenarios, and backward compatibility to guide coordinated updates and mitigate risk to downstream workflows.
Integration Points and Workflow Transitions
- Test case generation: Notification from model registry triggers AI-driven scenario selection.
- Defect classification: Inference endpoints updated via Seldon Core to apply new severity and root-cause models.
- Predictive dashboards: BI platforms ingest updated models to refresh release readiness forecasts and risk visualizations.
- CI/CD integration: DevOps pipelines in Jenkins, GitLab CI, or Azure DevOps include validation steps, rollback conditions, and performance monitoring hooks prior to model promotion.
Governance Controls and Approval Mechanisms
- Automated approval gates within delivery pipelines enforcing performance thresholds before promotion.
- Semantically versioned inference APIs allowing clients to opt into new models or default to stable versions.
- Immutable audit trails in the model registry capturing approvals, evaluation results, and manual overrides.
- Canary deployments with real-time monitoring to validate new models prior to full rollout.
These controls ensure functional improvements align with organizational and regulatory standards, providing safety nets against untested changes.
Sustaining the Next Automation Cycle
By defining clear deliverables, mapping dependencies, and enforcing governance, teams accelerate the integration of enhanced AI capabilities into test generation and defect analysis tools. Transparent documentation, version control, and automated pipelines create a repeatable, scalable CI/CD and MLOps framework that drives continuous quality improvement and reduces defect escape rates across software releases.
Conclusion
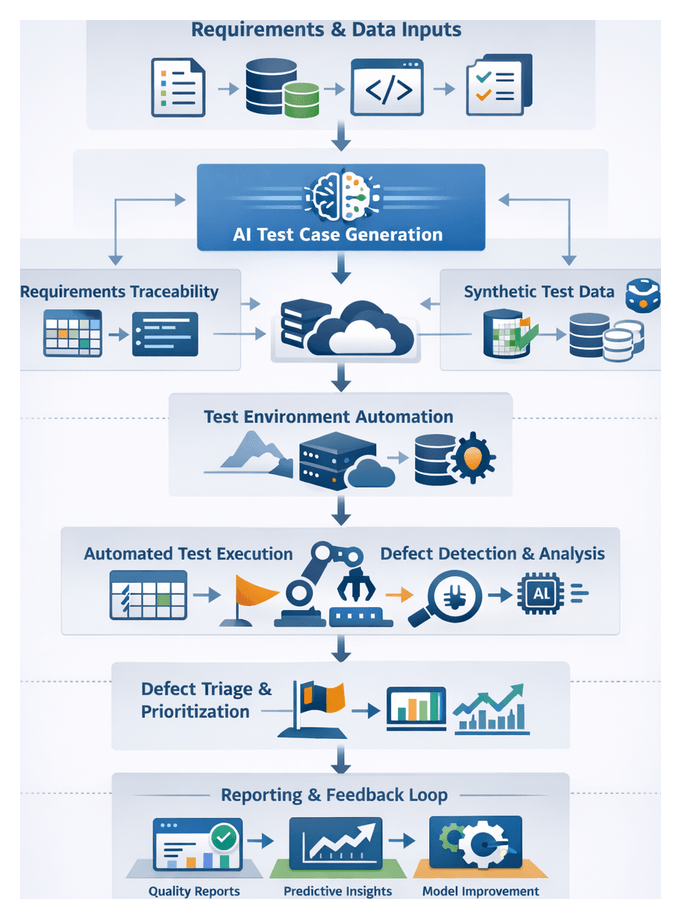
End-to-End Workflow Recap
Purpose and Objectives
Consolidating all stages of an AI-driven automated testing pipeline provides a unified view of activities from requirements intake to quality reporting. This governance activity validates completeness, ensures traceability, aligns stakeholders, drives continuous improvement, and establishes baseline metrics for ongoing performance measurement.
Major Workflow Stages
- Requirements Integration and Traceability: Capture user stories, generate trace matrices linking specifications to automated test cases.
- AI-Powered Test Case Generation: Use natural language processing and model-based techniques to create and prioritize scenarios based on risk and historical defects.
- Infrastructure and Environment Automation: Provision on-demand test environments via Terraform or container orchestration, guided by predictive analytics for capacity planning.
- Synthetic Test Data Management: Profile production data to generate compliance-safe datasets and apply AI-driven anonymization.
- Automated Execution and Scheduling: Define triggers on commits or schedules, and leverage AI scheduling agents to parallelize runs based on resource health.
- AI-Based Defect Detection and Classification: Analyze logs and telemetry to detect anomalies and classify defects by severity and root cause, integrating visual AI tools such as Applitools.
- Defect Triage and Prioritization: Employ predictive models to assess risk and automatically route issues to development teams.
- Result Analysis and Predictive Insights: Aggregate results and logs to forecast release readiness and identify quality trends.
- Continuous Feedback and Model Refinement: Ingest execution data and user feedback to retrain AI components, managing versions to adapt to evolving systems.
Inputs and Preconditions
Effective recaps rely on the following artifacts, data sources, and organizational foundations:
- Requirements documentation and trace matrices
- Test scripts, scenario definitions, and prioritization metadata
- Infrastructure definitions (Terraform scripts, Kubernetes manifests)
- Synthetic data catalogs with anonymization and quality metrics
- Execution logs and scheduling reports
- Defect analysis enriched with AI-driven classification
- Dashboards for risk, quality analytics, and AI model performance
- Data from CI/CD servers such as Jenkins and GitLab; test management via platforms like TestRail; environment monitoring with Prometheus and Grafana; defect tracking in Jira or Azure Boards; and analytics from Splunk or Elasticsearch.
- Cross-functional roles, access controls, integrated toolchains, data governance policies, and a continuous improvement framework
Realized Operational Efficiencies
By capturing and analyzing pipeline metrics, organizations translate automation into business value, demonstrating gains in speed, coverage, stability, and cost efficiency. This stage validates prior investments and informs strategic decisions across QA, development, and executive teams.
Data Flow and Analysis
- Data Ingestion: Collect metrics from CI/CD logs (Jenkins, GitLab CI), test management platforms (TestRail, Zephyr), and observability suites (Grafana, Splunk).
- Aggregation and Normalization: AI-driven middleware aligns schemas, validates completeness, and flags anomalies.
- Insights Generation: Analytical engines apply statistical and machine learning models to detect trends, while predictive dashboards forecast indicators such as regression detection rates or mean time to resolution.
- Reporting and Collaboration: Automated workflows distribute summaries and detailed QA reports; cross-functional reviews prioritize improvements back into the pipeline.
Efficiency Dimensions
- Speed and Throughput: Measured by average test execution time, parallelization efficiency, and release cycle reduction. AI scheduling agents adapt runs to resource availability.
- Coverage and Depth: Tracked via requirement-to-test trace rate, code coverage metrics, and scenario diversity from AI-generated tests.
- Reliability and Stability: Assessed through pipeline flakiness rates, environment availability, and MTTR for infrastructure issues. AI agents proactively remediate with automated container restarts and scaling.
- Resource Utilization and Cost: Evaluated by compute usage, environment spin-up time, and cost per cycle. Predictive analytics guide dynamic provisioning to balance performance and expenditure.
Insights on these dimensions feed back into model retraining triggers, parameter updates for scheduling and provisioning, and strategic roadmaps for QA maturity, ensuring a culture of data-driven optimization.
Strategic Impact of AI Orchestration
Embedding AI agents across testing stages elevates quality assurance into strategic quality engineering, enabling proactive risk management, cost optimization, accelerated innovation, and competitive differentiation.
Risk Reduction and Proactive Defect Prevention
Predictive analytics models assign risk scores based on commit history and past failures, driving targeted test execution. Anomaly detection agents surface environment or performance deviations, while automated root cause workflows correlate logs, screenshots, and telemetry to expedite diagnostics.
Enhanced Predictability and Decision Support
Time series forecasting predicts defect discovery rates and testing throughput, enabling release managers to adjust scope proactively. Natural language generation engines craft business-friendly quality summaries, and interactive dashboards powered by Power BI offer drill-down visuals for rapid exploration.
Operational Cost Optimization
Capacity forecasting algorithms analyze historical usage to inform dynamic provisioning via Terraform, while AI-driven test parallelization maximizes throughput within resource constraints. These practices minimize idle infrastructure and control expenses.
Accelerating Innovation and Time to Market
Natural language processing models convert requirement changes into test scenarios in minutes. Continuous integration agents trigger relevant suites on code commits, and self-healing scripts adapt to minor UI or API shifts, reducing maintenance overhead. Tools such as Testim leverage AI to refine test logic based on application behavior.
Competitive Differentiation and Business Value
Streamlined release cycles empower rapid responses to customer feedback, while predictive quality insights reduce support costs and enhance brand reputation. By offloading routine tasks, skilled engineers shift focus to innovation, unlocking higher customer satisfaction and market agility.
AI Agents and Supporting Systems
- Requirement analysis agents using NLP to validate coverage
- Test design models for prioritization and parameterization
- Environment orchestration engines automating provisioning and scaling
- Execution scheduling agents optimizing throughput
- Anomaly detection systems monitoring real-time metrics
- Defect classification models categorizing failures
- Predictive quality dashboards aggregating multi-source data
- Feedback orchestrators automating model retraining pipelines
Framework Adaptability and Next Steps
Long-term success requires a modular framework capable of evolving with business needs, technology advances, and organizational growth. Key strategies span customization, integration, governance, and scaling.
Adapting to Diverse Contexts
- Align workflow scopes to compliance, DevOps velocity, or hybrid infrastructures
- Integrate with existing platforms for requirements, source control, CI/CD, and issue tracking
- Customize AI functions—test generation, defect classification, predictive analytics—to domain-specific vocabularies
- Define governance and ownership roles for model management, environment provisioning, and feedback loops
Customizing AI Models
- Select and train models with APIs such as OpenAI GPT-4 or domain-specific NLP and pattern detection algorithms
- Curate high-quality datasets reflecting codebases, requirement formats, and user behaviors
- Tune parameters for anomaly thresholds, classification confidence, and test prioritization
- Implement continuous learning pipelines that incorporate execution outcomes and stakeholder feedback
Integrating Emerging Tools and Standards
- Use plugin-based connectors for Terraform, Jenkins, GitHub Actions, and Selenium
- Adopt API-first designs with RESTful or gRPC interfaces and webhook callbacks
- Containerize agents and test runners to simplify deployment across environments
- Adhere to open standards like Test Anything Protocol for test cases and JSON or YAML for data exchange
Roadmap for Implementation
- Conduct a pilot study on a representative project, instrumenting key metrics and gathering feedback
- Validate core metrics—throughput, detection rates, provisioning times, model accuracy—against legacy baselines
- Refine AI thresholds, integration logic, and documentation based on pilot outcomes
- Establish governance frameworks defining roles for AI validation, data stewardship, and compliance
- Scale across teams with training, playbooks, and support channels
- Implement continuous monitoring dashboards for pipeline health and AI drift alerts
- Plan periodic model retraining based on data volume and performance trends
- Foster a culture of learning through shared best practices and a central knowledge repository
Governance and Change Management
- Define responsibilities for model stewardship, workflow configuration, and incident management
- Develop training programs covering AI-driven testing fundamentals and tool usage
- Document security, privacy, and audit policies, integrating automated compliance checks
- Maintain transparent communication via demos, status updates, and performance reports
Scaling from Pilot to Enterprise
- Allocate infrastructure for parallel environments and model training workloads
- Standardize processes into reusable templates and offer self-service pipeline instantiation
- Optimize performance through load balancing, caching, and resource pooling
- Promote cross-team collaboration via communities of practice
- Secure executive sponsorship by presenting consolidated metrics on cycle times, defect rates, and quality predictability
Measuring Success and Refining Roadmaps
- Track time to test completion against SLAs
- Monitor AI classification precision and recall
- Measure environment utilization and idle times
- Assess model drift to trigger retraining cycles
- Gauge stakeholder satisfaction through periodic surveys
Regular reviews of quantitative metrics and qualitative feedback ensure the framework evolves to deliver continuous ROI and reinforces the strategic role of AI orchestration in software delivery.
Appendix
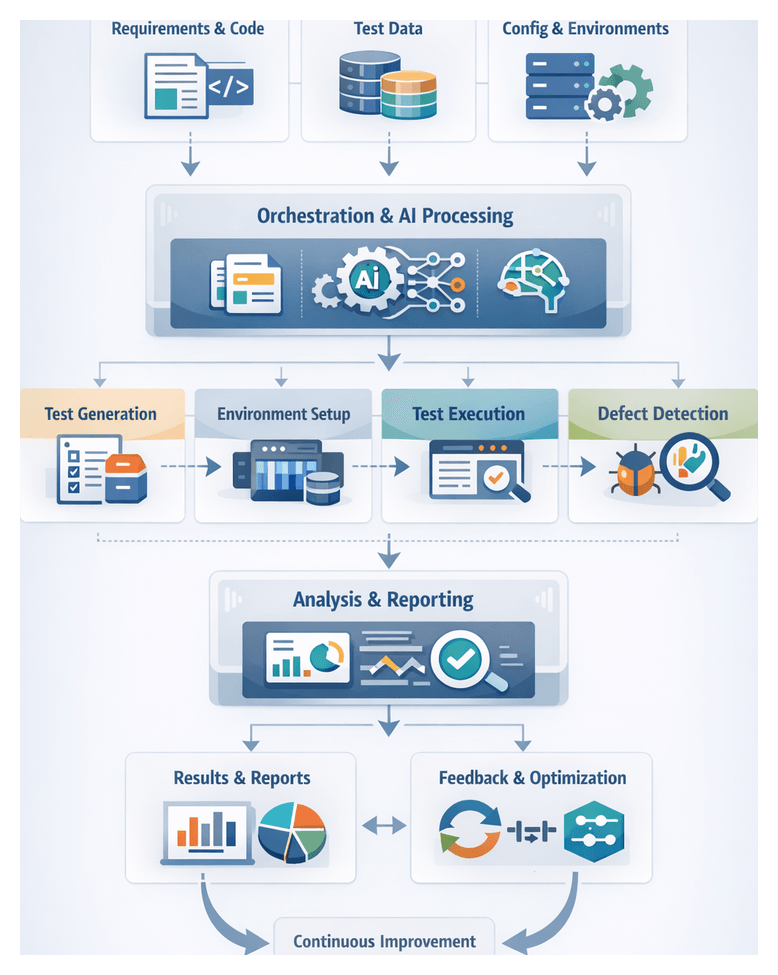
Key Workflow Terminology and Concepts
Establishing and standardizing terminology is critical for aligning development, quality assurance, operations and data science teams around AI-driven testing workflows. A shared vocabulary accelerates stakeholder onboarding, reduces miscommunication and enables consistent documentation, traceability and automation. The following definitions provide the foundational language for orchestrating tools, data and intelligence across the testing lifecycle.
Workflow Fundamentals
- Workflow: A coordinated sequence of stages that transforms inputs—requirements, code, configurations—into validated outputs such as test results, defect reports and analytics dashboards. In AI-enabled pipelines, workflows span requirement ingestion, test design, environment provisioning, execution, defect analysis and continuous feedback loops.
- Stage: A logical grouping of activities within a workflow that consumes specified inputs, applies processing actions and produces outputs for downstream stages. Common implementations use pipeline steps in CI/CD platforms like Jenkins or GitLab CI/CD.
- Transition: The automated handoff between stages, managing artifact transfer, metadata propagation and validation checks. Transitions are triggered by completion events, webhooks or message queue notifications and ensure reliability through standard formats and API contracts.
- Artifact: A versioned data object produced or consumed by stages. Examples include test case definitions, environment configurations, synthetic datasets, execution logs, defect tickets and analytics reports. Artifacts are stored in source control, artifact repositories or data lakes.
- Handoff: Delivery of artifacts and contextual metadata from one stage to the next. Robust handoffs rely on error handling protocols, schema validation and idempotent operations to prevent data inconsistency.
- Orchestration Layer: The central control plane that sequences stages, manages dependencies, enforces policies and monitors status. Orchestration-as-code platforms such as Apache Airflow and Kubeflow enable repeatable, auditable pipelines by defining workflows in declarative configurations or code.
AI-Specific Terminology
- AI Agent: A modular software component that uses artificial intelligence techniques—NLP, predictive analytics or reinforcement learning—to perform specialized tasks within the testing workflow. Agents expose APIs for integration with orchestration platforms and other services.
- Machine Learning Model: A trained statistical or algorithmic representation that maps inputs to outputs. Common examples include classification models for defect severity, regression models for capacity forecasting and sequence models for log anomaly detection.
- Natural Language Processing (NLP): Techniques that enable AI agents to interpret and extract meaning from human language artifacts—user stories, acceptance criteria, defect descriptions—supporting automated requirement analysis and triage.
- Predictive Analytics: The application of machine learning and statistical methods to forecast future events, such as defect trends, release readiness or infrastructure demand. Predictive agents consume historical and real-time data to generate risk scores and recommendations.
- Reinforcement Learning: A paradigm where AI agents learn optimal policies through trial and error, receiving rewards or penalties based on outcomes. It is leveraged to optimize test execution order, environment allocation and scheduling decisions over successive cycles.
Testing Automation Terminology
- Test Case: A scripted scenario defining inputs, actions and expected outcomes. Test cases may be generated by AI-driven tools such as Testim or authored manually in frameworks like Selenium WebDriver and Cypress.
- Test Suite: A logical grouping of test cases organized by feature, component or risk. Suites enable parallel execution, selective validation and efficient regression testing.
- Traceability Matrix: A mapping structure that links requirements to test cases and defects, ensuring coverage and facilitating impact analysis when requirements or application code change.
- Flakiness: The tendency for tests to fail intermittently due to environmental instability or non-deterministic behavior. AI-driven flakiness detection identifies unstable tests and triggers self-healing actions, such as retries or environment reprovisioning.
- Code Coverage: A metric representing the percentage of code paths exercised by automated tests. Coverage reports integrate with tools like SonarQube to guide test design and highlight gaps.
Infrastructure and Environment Terminology
- Infrastructure as Code (IaC): The practice of defining and managing environment configurations—compute, network, storage—in code stored in version control. IaC tools such as Terraform and Kubernetes operators automate environment provisioning, scaling and teardown.
- Containerization: Packaging applications and dependencies into portable containers. Platforms like Docker provide consistent runtime environments across development, testing and production.
- Capacity Planning: Forecasting infrastructure needs based on test volume, parallelism targets and historical usage. AI-driven planners allocate compute resources proactively to maintain throughput and optimize costs.
- Synthetic Test Data: Artificial datasets that mimic production data distributions while preserving privacy. Engines such as Tonic.ai and Gretel.ai apply machine learning to generate realistic test records.
Defect Management Terminology
- Defect Detection: Automated identification of test failures, anomalies or regressions. AI agents analyze logs, screenshots and telemetry to detect defects beyond simple pass/fail criteria.
- Defect Classification: Assigning severity, root cause and component tags to detected issues using classification models—gradient boosting, deep neural networks or ensemble methods.
- Defect Triage: Evaluating and routing defects to appropriate teams based on predictive risk scores, business impact and resource availability. AI-driven triage engines automate prioritization and assignment.
- Dynamic Prioritization: Adaptive adjustment of defect order in the backlog in response to emerging risk indicators, business priorities or resource constraints.
Analytics and Feedback Terminology
- Predictive Quality Insights: Actionable forecasts and recommendations derived from analytics models, indicating release readiness, defect hotspots and process bottlenecks.
- Release Readiness: A composite metric combining test coverage, defect backlog severity, environment stability and business impact assessments to quantify deployment risk.
- Continuous Feedback Loop: The cyclical process of feeding execution outcomes and production telemetry back into model retraining, automation logic refinement and workflow parameter updates.
- MLOps: Integrating machine learning model development, deployment and monitoring into DevOps pipelines to ensure version control, governance and performance tracking of AI components.
- Model Drift: The degradation of model accuracy over time due to changes in input data distributions or application behavior. Drift detection agents trigger retraining when performance falls below defined thresholds.
AI Capability Mapping by Workflow Stage
Mapping AI functions to distinct workflow stages clarifies where intelligence augments traditional testing processes. By defining the role of AI agents, integration points with supporting systems and expected outcomes at each phase, organizations ensure that every stage—from requirement ingestion to feedback loop—benefits from data-driven insights, predictive analysis and self-optimizing actions.
Stage 1: Requirements Ingestion and Validation
AI agents enrich the initial intake of requirements by transforming free-form text into structured, testable criteria:
- Natural language processing to extract entities, actions and acceptance criteria (IBM Watson Natural Language Understanding, Google Cloud Natural Language API).
- Named-entity recognition identifying features, user roles and business rules.
- Ambiguity detection flagging unclear or conflicting statements for human clarification.
- Automated trace link generation suggesting mappings between new requirements and existing test cases.
- Priority tagging based on risk indicators derived from historical defect and usage data.
Stage 2: AI-Assisted Test Case Generation and Prioritization
Intelligent tools accelerate test design by analyzing specifications, code and defect history:
- Model-based scenario synthesis extracting state transitions from interface definitions.
- Machine learning models identifying high-risk areas using past defect distributions.
- Predictive ranking of generated test cases by expected defect discovery potential.
- Automated conversion of scenario outlines into executable scripts for frameworks like Selenium WebDriver and Cypress.
- Continuous learning from manual test results to refine generation heuristics (GitHub Copilot, Diffblue Cover).
Stage 3: Environment and Data Provisioning
AI optimizes allocation and configuration of test environments and datasets:
- Predictive capacity planning using time-series forecasts of workload (Azure DevOps Pipelines, Terraform).
- Automated provisioning scripts selecting optimal instance types or container resources (Ansible, Kubernetes).
- Synthetic data generation preserving statistical fidelity while enforcing privacy constraints (Tonic.ai, Gretel.ai).
- Dynamic selection of environment parameters based on test case requirements and historical performance.
- Cost-optimization recommendations balancing resource needs with budget targets.
Stage 4: Automated Test Execution and Adaptive Scheduling
During execution, AI agents manage workload distribution and respond to environment conditions:
- Real-time monitoring of node health metrics to predict and avoid resource bottlenecks (Datadog, New Relic).
- Dynamic test suite parallelization adjusting concurrency in response to queue length.
- Anomaly detection identifying flakiness or environment drift mid-run and triggering retries or reprovisioning.
- Reinforcement learning to optimize execution order for minimal overall cycle time.
- Self-healing actions restarting unstable nodes or rerouting tests to healthier infrastructure (AgentLink AI).
Stage 5: AI-Based Defect Detection and Classification
AI agents analyze multi-modal execution artifacts to identify and categorize failures:
- Log pattern recognition using supervised and unsupervised models (Splunk, Dynatrace).
- Computer vision for screenshot comparison and visual regression detection (Applitools, Mabl).
- NLP of exception messages and stack traces to extract root cause candidates.
- Classification of defects by severity, component and impact probability.
- Enrichment of defect tickets with contextual metadata—dependencies, telemetry snapshots and execution traces.
Stage 6: Defect Triage and Dynamic Prioritization
AI-driven risk assessment models guide assignment and scheduling of defect resolution:
- Predictive risk scoring combining business impact metrics and historical resolution data (DataRobot).
- Automated routing of issues to teams or individuals based on expertise and current workload.
- Adaptive reprioritization as new defects emerge or code changes alter risk profiles.
- Escalation triggers for high-severity defects that exceed predefined SLAs.
- Continuous monitoring of backlog health and notification of stale or overdue defects.
Stage 7: Result Analysis and Predictive Quality Insights
AI extracts strategic insights from aggregated quality data to inform release decisions:
- Time-series forecasting of defect trends and test stability metrics (Prometheus, Power BI).
- Clustering to identify hotspots in code modules or feature areas.
- Root-cause prediction models linking test failures to likely code changes or configurations.
- Executive readiness scores combining coverage, defect backlog and resource utilization.
- What-if simulations to assess the impact of test scope adjustments or release schedule shifts.
Stage 8: Continuous Feedback Loop and Model Refinement
Feedback from execution outcomes drives ongoing model retraining and workflow improvements:
- Automated ingestion of new execution and defect data into model training pipelines (MLflow, Kubeflow).
- Drift detection agents monitoring feature distributions and performance metrics over time.
- Scheduled retraining of test generation, classification and scheduling models on refreshed datasets.
- Canary and blue-green deployments of updated models with rollback safeguards.
- Data-driven tuning of workflow parameters—parallelization factors and environment capacity limits.
Central orchestration tools such as GitHub Actions, GitLab CI/CD and Apache Airflow coordinate AI agents, CI servers, IaC platforms and analytics engines through standardized APIs, event buses and containerized microservices, creating a self-optimizing, adaptive testing ecosystem.
Variations and Edge Case Handling
AI-driven testing workflows must accommodate organizational differences, legacy integrations, resource constraints, regulatory requirements and technical anomalies. Embedding flexible orchestration logic and AI-powered handling strategies ensures resilience and scalability across diverse environments.
Workflow and CI/CD Variations
Organizations adopt unique processes based on team structures, industry regulations and platform choices. Differences emerge in branching strategies (trunk-based, GitFlow), approval models (formal change boards, GitOps triggers) and notification channels. Parameterizing pipeline definitions via policy-as-code frameworks or configuration files allows a single workflow definition to support multiple models without rewriting automation scripts.
Integrating Legacy Frameworks
Legacy test suites and in-house tools often use proprietary scripting languages or unsupported data formats. Adapter layers transform legacy artifacts—such as custom XML exports—into standard schemas like JUnit, enabling AI-driven classification and analysis without discarding existing investments.
Managing Resource Constraints
Not all teams have unlimited cloud or on-premise capacity. In constrained environments, AI agents apply intelligent batching and scheduling strategies:
- Combining low-risk tests into single runs, reserving parallel slots for high-priority scenarios.
- Deferring noncritical performance suites to off-hours or leveraging spot instances with automated retries upon preemption.
- Monitoring real-time resource metrics to dynamically calibrate load and prevent overcommitment.
Regulatory and Compliance Considerations
Regulated industries impose strict data privacy, traceability and audit requirements. Workflows incorporate:
- Synthetic data generation with differential privacy parameters (Privitar, ARX Data Anonymization Tool).
- Conditional branching and manual approval steps for any dataset release containing PII.
- Comprehensive audit logs capturing every transformation, access event and approval.
- Full anonymization or manual review before executing tests involving sensitive data.
Handling Flaky Tests and Third-Party Dependencies
Intermittent failures and external service outages require self-healing and virtualization:
- Flakiness detection analyzes failure patterns to trigger retries, quarantine or isolated reruns, while dashboards surface instability metrics for proactive maintenance.
- Service virtualization platforms and mock solutions supply stable responses during API outages or rate limiting.
- Contract-testing and monitoring webhooks detect schema changes or authentication updates, dynamically switching to recorded stubs or sandbox endpoints to maintain pipeline continuity.
UI and Frontend Diversity
Testing across browsers, resolutions and devices introduces visual and functional edge cases:
- AI-driven visual validation tools apply configurable tolerance levels to distinguish true regressions from acceptable styling variations (Applitools, BrowserStack).
- Dynamic test selection adjusts to responsive design breakpoints and A/B testing variations.
- Centralized device farm orchestrators distribute test runs across required browser-device matrices.
Distributed Team Practices and Model Drift
Global organizations with multiple teams and tenancies require per-team configurations and drift safeguards:
- Policy engines detect team identifiers in commit metadata or pipeline contexts to apply custom quality gates, test-selection criteria and notification channels.
- Drift-detection agents monitor model confidence. Predictions below thresholds are routed to manual review queues or backup rule-based heuristics.
- Periodic cross-functional reviews ensure that variation handling mechanisms evolve alongside team practices and tool updates.
Best Practices for Resilient Workflows
- Parameterize workflows via configuration files or policy-as-code frameworks to accommodate organizational differences without code changes.
- Implement adapter layers that normalize legacy artifacts and integrate with modern AI agents.
- Design orchestration pipelines with conditional branches, manual approval gates and fallback strategies for edge cases.
- Monitor flakiness, model confidence and data drift in real time to detect and remediate anomalies promptly.
- Maintain comprehensive documentation of variations, exceptions and handling mechanisms for auditability and knowledge transfer.
- Engage cross-functional teams in periodic reviews to align variation handling with evolving practices and tool updates.
AI Tools and Resources
The following AI-driven products, platforms and resources support test design, environment provisioning, execution orchestration, defect analytics, data management and MLOps within modern testing pipelines.
- GitHub Copilot: An AI-powered code completion assistant that accelerates test script authoring by suggesting code snippets and entire functions.
- IBM Watson Natural Language Understanding: An NLP service that parses requirements and user stories to extract entities, relationships, and intent for automated test case generation.
- Google Cloud Natural Language API: A managed NLP platform used to analyze specification documents and classify requirement types for AI-driven test planning.
- Testim: An AI-based test automation solution that generates and maintains end-to-end UI tests using machine learning to adapt locators and flows.
- Mabl: A cloud-native, AI-infused testing tool for functional and visual regression testing that learns application behavior over time.
- Selenium WebDriver: A widely used open-source framework for web UI automation, often enhanced with AI for locator resilience.
- Cypress: A modern end-to-end testing framework with real-time reloading and network traffic control, integrated with AI analytics.
- Appium: An open-source tool for automating mobile applications, leveraged in AI-driven pipelines for adaptive test execution across devices.
- Tricentis Tosca: A commercial continuous automation platform with model-based testing and AI-powered impact analysis.
- Terraform: An infrastructure-as-code tool used with AI capacity planners to provision and scale test environments predictively.
- Ansible: A configuration management engine that applies declarative playbooks, integrated with AI modules for self-healing deployments.
- Docker: A containerization platform that packages test environments, enabling AI-driven orchestration of isolated test instances.
- Kubernetes: A container orchestration system that auto-scales test runners based on predictive analytics for resource demand.
- Azure DevOps Pipelines: A CI/CD platform that integrates AI agents for dynamic test scheduling and real-time resource allocation.
- GitHub Actions: A workflow automation engine that triggers AI-enhanced testing pipelines on code commits and pull requests.
- GitLab CI/CD: An integrated DevOps platform that orchestrates AI-powered test generation, execution, and analytics stages.
- Jenkins: A popular open-source automation server augmented with AI plugins for predictive scheduling and anomaly detection.
- Selenium Grid: A distributed testing infrastructure that leverages AI for intelligent session routing and node health monitoring.
- BrowserStack: A cloud-based device and browser testing service integrated with AI-driven failure classification and retry logic.
- New Relic: An application performance monitoring platform whose telemetry feeds AI-based environment health agents.
- Datadog: A monitoring service providing real-time metrics and logs to AI modules for predictive scaling and anomaly detection.
- Dynatrace: An AIOps platform that applies machine learning to trace dependencies and surface defect root causes in distributed architectures.
- Splunk: A data analytics engine used for log aggregation and AI-powered pattern recognition in defect detection.
- TestRail: A test case management tool integrated with AI-driven coverage analysis and defect linkage.
- QMetry: An enterprise test management suite that leverages AI for traceability and impact analysis.
- Postman: An API development environment whose collections feed AI-based integration test generators via OpenAPI contracts.
- Swagger Codegen: A tool to generate API client code from OpenAPI specifications, used by AI agents to create integration tests.
- Applitools: An AI-driven visual testing platform that detects UI regressions using computer vision and adaptive learning.
- Functionize: A cloud-native test automation service that uses machine learning to maintain test scripts and adapt to UI changes.
- Diffblue Cover: An AI tool that automatically generates Java unit tests by analyzing code paths and dependencies.
- Test.ai: A platform employing AI to create and maintain mobile and web UI tests by learning from user interactions.
- Gretel.ai: A synthetic data generation framework that uses machine learning to produce privacy-preserving datasets.
- DataRobot: An enterprise AI platform offering automated model training, deployment, and MLOps for defect prediction and risk assessment.
- Tonic.ai: A data synthesis solution that learns data distributions to generate realistic test records while enforcing privacy constraints.
- ARX Data Anonymization Tool: An open-source framework for k-anonymity and clustering-based data anonymization, employed in synthetic data pipelines.
- Privitar: A data privacy platform that automates policy enforcement and anonymization for test datasets.
- Aircloak: A privacy solution using AI for dynamic query anonymization and synthetic data generation.
- BigID: An AI-powered data discovery and privacy risk assessment tool integrated into data governance workflows.
- Trifacta: A data preparation platform employing machine learning to suggest transformations and cleanse test data.
- MLflow: An open-source platform for managing the machine learning lifecycle, including tracking, projects, and model registry.
- Kubeflow: A Kubernetes-native framework for deploying scalable machine learning pipelines, used to orchestrate model retraining.
Additional Context and Resources
- Atlassian Jira: The industry-leading issue and project tracking tool referenced for requirement management and defect tracking.
- Azure DevOps Boards: Microsoft’s agile tracking service used for capturing user stories, tasks, and backlog items.
- IBM Engineering Requirements Management DOORS Next: A requirements management platform supporting traceability and compliance documentation.
- Terraform Documentation: Official guide to infrastructure-as-code patterns for provisioning test environments.
- Kubernetes Documentation: Reference for container orchestration and environment scaling best practices.
- Docker Documentation: Resources for building and deploying container images in test pipelines.
- OpenAPI Specification: The standard format for defining RESTful API contracts used in automated integration testing.
- Postman API Platform: A collaborative environment for API development and automated testing.
- Jenkins User Documentation: Guides for creating pipelines that integrate AI-driven tasks.
- GitLab Documentation: Reference for CI/CD configuration and pipeline orchestration.
- CircleCI Docs: Instructions for implementing test automation workflows and parallel job orchestration.
- Elastic Stack Guide: Documentation for logging, search, and analysis of test execution and application logs.
- Prometheus Guide: Reference for collecting and querying time-series metrics from test environments.
- Grafana Documentation: Tutorials for building dashboards that visualize testing KPIs and predictive insights.
- Power BI Documentation: Microsoft’s guidance on creating interactive business intelligence reports for test analytics.
- Tableau Training and Resources: Materials for designing executive-level dashboards that synthesize AI-driven quality forecasts.
- Apache Kafka Documentation: Documentation for using event streams to coordinate AI agents and orchestration workflows.
- RabbitMQ Docs: Guides for implementing reliable messaging between test automation components.
- MLflow Model Registry: Instructions for versioning and managing machine learning models in production workflows.
- Seldon Core: An open-source platform for deploying, scaling, and monitoring machine learning models in Kubernetes.
- Kubeflow Pipelines: Tutorials for building end-to-end ML workflows on Kubernetes.
- Collibra Data Intelligence Cloud: A data governance platform for cataloging schemas, lineage, and compliance policies related to test data.
- Informatica Data Quality: Tools for profiling and cleansing test datasets ahead of synthetic data generation.
- HAProxy Documentation: Guidance for configuring load balancers to distribute test execution traffic across environment nodes.
- HashiCorp Vault: A secrets management solution for injecting passwords, API keys, and certificates into test environments securely.
- AWS CloudWatch: Documentation on collecting logs and metrics from cloud-based test infrastructures.
- Azure Monitor: Microsoft’s unified portal for monitoring application and environment health.
- Apache Airflow Documentation: Guides for authoring and scheduling data and model pipelines.
- MLflow Documentation: Tutorials on tracking experiments, packaging code, and deploying models in MLOps pipelines.
- DataRobot Resource Center: Whitepapers and case studies on automating AI for quality assurance.
- Tonic.ai Resources: Best practices for synthetic data generation and privacy compliance in testing workflows.
- Gretel.ai Resources: Documentation and tutorials on building synthetic data pipelines with machine learning.
The AugVation family of websites helps entrepreneurs, professionals, and teams apply AI in practical, real-world ways—through curated tools, proven workflows, and implementation-focused education. Explore the ecosystem below to find the right platform for your goals.
Ecosystem Directory
AugVation — The central hub for AI-enhanced digital products, guides, templates, and implementation toolkits.
Resource Link AI — A curated directory of AI tools, solution workflows, reviews, and practical learning resources.
Agent Link AI — AI agents and intelligent automation: orchestrated workflows, agent frameworks, and operational efficiency systems.
Business Link AI — AI for business strategy and operations: frameworks, use cases, and adoption guidance for leaders.
Content Link AI — AI-powered content creation and SEO: writing, publishing, multimedia, and scalable distribution workflows.
Design Link AI — AI for design and branding: creative tools, visual workflows, UX/UI acceleration, and design automation.
Developer Link AI — AI for builders: dev tools, APIs, frameworks, deployment strategies, and integration best practices.
Marketing Link AI — AI-driven marketing: automation, personalization, analytics, ad optimization, and performance growth.
Productivity Link AI — AI productivity systems: task efficiency, collaboration, knowledge workflows, and smarter daily execution.
Sales Link AI — AI for sales: lead generation, sales intelligence, conversation insights, CRM enhancement, and revenue optimization.
Want the fastest path? Start at AugVation to access the latest resources, then explore the rest of the ecosystem from there.