

AI Enhanced Risk Mitigation Workflow for Financial Services
To download this as a free PDF eBook and explore many others, please visit the AugVation webstore:
Introduction
Evolving Risk Landscape
Financial institutions face a rapidly shifting environment of cyber threats, complex regulations and volatile markets. Recent advancements in digital banking, open APIs and real-time transaction platforms have expanded the attack surface, allowing criminals to exploit legacy system vulnerabilities, synthetic identities and sophisticated phishing campaigns. At the same time, regulators update guidelines on anti-money laundering, data privacy and capital adequacy, demanding a proactive understanding of emerging risks.
Key drivers shaping this landscape include escalating cyberattacks such as ransomware and supply chain intrusions, intensifying regulatory mandates, market volatility from geopolitical events, digital transformation complexities and rising customer expectations for security and seamless experiences. A structured overview of these factors creates a unified risk taxonomy, aligns cross-functional teams on shared definitions and underpins AI-driven analyses with relevant context.
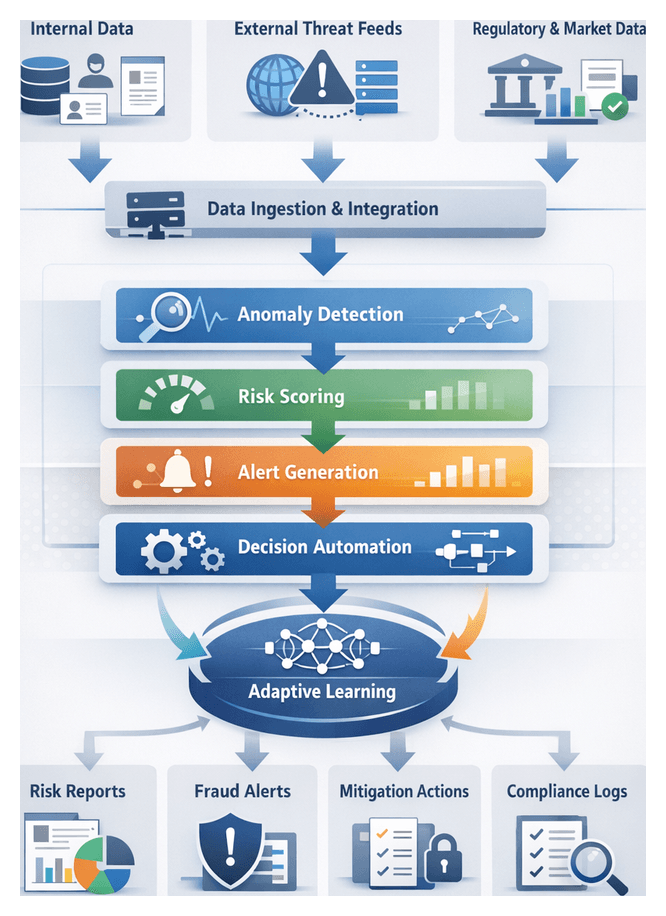
To build this foundation, institutions must aggregate inputs from:
- Internal Data Sources such as historical transactions, customer profiles, credit assessments and operational logs
- External Intelligence Feeds including threat actor reports, vulnerability disclosures and global sanction lists
- Regulatory and Market Data covering enforcement actions, policy updates, market indices and macroeconomic indicators
Technological prerequisites include a unified data infrastructure with real-time connectivity to intelligence sources, governed by a robust data governance framework that enforces quality and lineage. Organizational prerequisites encompass executive sponsorship, cross-disciplinary collaboration among risk, compliance, IT and business units, and a skilled analytics team. Environmental conditions such as continuous data refresh, standardized taxonomies, scalable compute resources and strong security controls ensure the overview remains current and actionable.
Consistent Risk Workflow Foundation
A repeatable, transparent risk workflow is essential to process high volumes of data, detect threats in real time and satisfy regulatory requirements. By codifying discrete phases—data ingestion, signal detection, risk scoring, recommendation generation and response orchestration—institutions create a predictable process flow that reduces friction and accelerates remediation.
Predictable Process Flow
- Data intake and normalization via preconfigured connectors and streaming platforms ensure uniform record formats
- Signal identification follows a scan-classify-tag pattern, applying consistent feature-extraction logic
- Risk scoring uses standardized aggregation rules to produce comparable assessments
- Decision support modules generate recommendations with approved templates and severity rankings
- Response orchestration triggers actions through defined APIs and workflow engines, enforcing policies and regulatory mandates
System Coordination
Interconnected systems—transaction engines, threat intelligence platforms, AI inference services and orchestration tools—exchange data through:
- Event bus integration for decoupled publish-subscribe messaging
- REST or gRPC API contracts with versioned schemas
- Message queues and topics for reliable delivery and alert broadcasting
- Orchestration engine connectors to invoke identity verification, transaction holds and compliance report generators
Role Alignment and Accountability
Defined roles and handoffs drive accountability:
- Data Engineers maintain ingestion pipelines and data quality
- AI/ML Engineers develop, train and version detection models
- Risk Analysts review signals and adjust thresholds
- Compliance Officers verify that workflows meet regulatory standards
- Incident Response Teams investigate alerts and manage resolution
- IT Operations oversee orchestration engines and disaster recovery
Embedded tracking, immutable event logs, versioned artifacts, digital signatures and role-based access controls ensure auditability and support root-cause investigations.
AI-Driven Risk Mitigation
Traditional rule-based systems struggle with the volume, velocity and variety of modern risk data. Integrating AI across the workflow enables automated preprocessing, real-time detection and adaptive learning to deliver timely, accurate risk insights.
Intelligent Data Connectivity and Preprocessing
AI-driven connectors and transformation engines ingest and normalize unstructured logs, extract features and reconcile taxonomies. Natural language processing identifies entity relationships in regulatory texts, while graph-based models reveal hidden transactional networks.
Supporting platforms include:
- Streaming ingestion with Apache Kafka and Confluent
- AI-powered clustering in data transformation engines to detect schema drift
- Enrichment via external threat feeds with entity resolution models
- Anomaly detection for quality assurance before downstream processing
Automated Detection and Classification
Normalized data fuels supervised and unsupervised models for real-time signal identification. Inference services score records against classification models while anomaly detection frameworks, including isolation forests and autoencoders, adapt to evolving patterns.
Key integrations feature lightweight inference engines, feature extraction pipelines computing statistical, temporal and graph metrics, and metadata tagging services that augment events with risk profiles, geolocation data and regulatory context.
Predictive Modeling and Risk Scoring
Ensemble methods combine tree-based models, gradient boosting and neural networks to generate composite risk scores that reflect both probability and potential impact. Model development and management leverage:
- TensorFlow and PyTorch for custom algorithm development
- AWS SageMaker for distributed training and drift monitoring
- DataRobot for automated feature engineering and model selection
- Experiment tracking and model registry systems for reproducibility and auditability
Orchestration and Real-Time Decisioning
Risk scores trigger automated workflows and alerts. Business logic engines enforce thresholds, prompting transaction holds, multi-factor authentication challenges or analyst review. Core components include:
- Camunda or Apache Airflow for workflow orchestration
- Edge-deployed inference services for sub-second responses
- Splunk Enterprise Security for centralized alerting and dashboards
- Integration adapters connecting core banking, CRM and incident response systems
Adaptive Learning and Continuous Optimization
Feedback from incident outcomes, audit findings and policy changes feeds automated retraining pipelines and policy management modules. Automated schedulers, experiment tracking dashboards and simulation environments support model refinement and safe deployment of workflow updates.
This adaptive framework sustains high detection accuracy, reduces false positives and ensures regulatory alignment.
Framework Overview and Strategic Deliverables
Solution architects translate risk insights, regulatory mandates and organizational goals into strategic deliverables that guide implementation. These artifacts include:
High-Level Framework Outputs
- Architectural Blueprint detailing data flows, system interfaces, AI model lifecycles, security controls and compliance checkpoints
- Interface and Data Schema Definitions with API contracts, field-level metadata and validation rules
- Technology Stack Inventory listing platforms such as Apache Kafka, Databricks and monitoring dashboards
- Governance and Compliance Matrix mapping regulations to workflow stages, controls and evidence artifacts
- Risk and Performance Metrics Catalog defining KPIs such as mean time to detection, false positive rate and model drift indicators
- Roadmap and Implementation Plan with phased deliverables, milestones and resource assignments
Dependencies and Integration Points
- Data Source Availability with stable access and change-management processes for core banking, transaction logs and threat feeds
- Infrastructure Readiness provisioning for batch and streaming workloads, CI/CD pipelines and container orchestration
- Regulatory Sign-Off from legal, compliance and audit functions
- Toolchain Integration with ETL platforms, AI environments like TensorFlow or PyTorch, orchestration engines such as Apache Airflow and monitoring dashboards
- Resource Alignment including data engineers, data scientists, security analysts, DevOps and compliance specialists
- Vendor Dependencies covering SLAs for threat intelligence, market data and managed services
Handoff and Continuity
A structured handoff to implementation teams involves transferring documentation, conducting workshops, logging issues and formalizing acceptance criteria. Phased kickoff of data ingestion planning leverages interface definitions, data schemas and security controls to preserve design intent and accelerate progress toward a unified, AI-driven risk mitigation capability.
Chapter 1: Data Ingestion and Integration
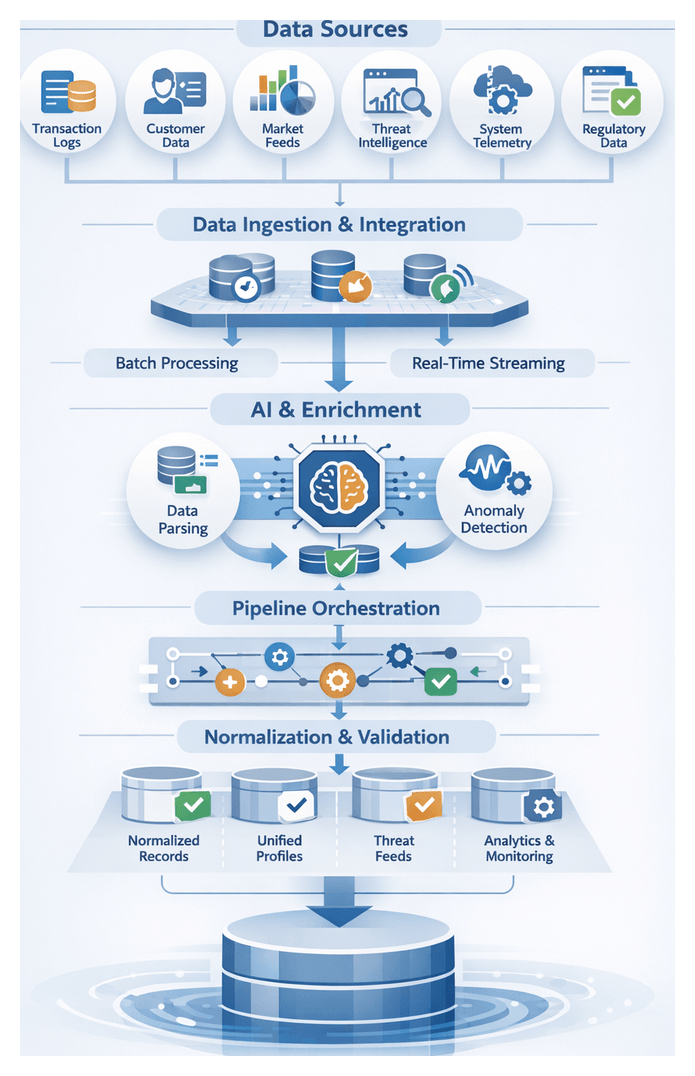
Establishing a unified foundation for AI-driven risk mitigation begins with systematic data ingestion from internal and external sources. Financial institutions must collect transaction logs, customer profiles, market data, threat intelligence, and system telemetry into a consistent, high-quality dataset. This layer accelerates downstream analytics, anomaly detection, and automated decision support while enforcing governance controls.
Key Data Sources and Inputs
- Transaction Logs: Payments, transfers, trade executions, and settlement events from core banking, trading, and payment platforms.
- Customer Profiles: KYC documentation, credit scores, device fingerprints and dynamic behavioral tags.
- Market Data Feeds: Pricing, exchange rates, and indicators from vendors and public sources.
- External Threat Intelligence: Indicators of compromise, blacklists, vulnerability alerts, and threat actor profiles.
- Network and System Telemetry: Firewall logs, intrusion detection alerts, and endpoint monitoring streams.
- Regulatory Feeds: Sanctions lists, policy bulletins, and compliance updates.
Prerequisites and Connectivity
- Secure Connectivity: Provision API endpoints, SFTP/FTPS, message queues or direct database links with OAuth or mutual TLS.
- Data Governance Framework: Define classification, retention, and access policies in compliance with GDPR, PCI DSS and similar regulations.
- Schema and Format Standards: Agree on common data models, schema registries and serialization formats (JSON, Avro, Parquet).
- Infrastructure Readiness: Ensure bandwidth, VPN tunnels and hybrid cloud architectures support high-throughput ingestion.
- Latency Objectives: Establish SLAs for data freshness to guide batch versus streaming choices.
Batch and Streaming Ingestion Strategies
An optimal ingestion framework combines batch and streaming pipelines:
- Batch Ingestion: Scheduled ETL jobs using AWS Glue and Apache Spark load high-volume historical data into data lakes or warehouses.
- Streaming Ingestion: Real-time capture via Apache Kafka, Amazon Kinesis or Google Pub/Sub to detect anomalies within seconds.
AI-Driven Connectors and Enrichment
To reduce manual mapping and accelerate time to insight, AI components perform intelligent parsing, enrichment and validation:
- AI-Driven Connectors: Natural language processing and pattern recognition engines such as Apache NiFi AI Extensions or Debezium infer schemas, extract entities and suggest field mappings.
- Automated Enrichment: Integrate third-party identity verification and geolocation services to add contextual risk metadata.
- Anomaly Detection: Unsupervised models flag schema changes or data spikes, triggering remediation before they impact downstream workflows.
Data Quality and Governance
Embedding validation and profiling early ensures trustworthy inputs:
- Schema Conformity: Automated checks verify field presence and data types against the central registry.
- Completeness and Range Checks: Validate numeric fields, patterns for IBANs or SWIFT codes, and referential integrity.
- Profiling and Cataloging: Data catalogs track lineage and metadata, enabling audit trails and root-cause analysis.
- Governance Controls: Policies enforce retention, access controls and encryption in transit and at rest.
Landing and Staging
Ingested data is temporarily staged in raw form before normalization. Checkpointing, backpressure handling and dead-letter queues manage ingestion failures. Alerts and retry policies maintain pipeline resilience while preventing data loss.
Pipeline Orchestration and Normalization
Once ingested, data flows through orchestrated pipelines that standardize schemas, enforce quality rules and prepare assets for analytics. Orchestration platforms manage both batch and streaming workflows, coordinating extraction, transformation and load tasks with auditability and scalability.
Orchestration Topology and Tools
- Directed Acyclic Graphs: Platforms like Apache Airflow, Azure Data Factory or Informatica Intelligent Cloud Services schedule and execute ETL tasks in dependency order.
- Parameterization: Dynamic configurations enable pipelines to adapt to varying data partitions, time windows and environments.
- CI/CD Integration: Version control of pipeline definitions ensures repeatable deployments and rollback capabilities.
- Retry Policies and SLAs: Built-in policies detect failures, enforce deadlines and notify on-call teams.
Stream Processing for Real-Time Normalization
Low-latency risk detection relies on continuous jobs in frameworks such as Apache Flink or Spark Structured Streaming:
- Field Reconciliation: Type casting, name mapping and currency code standardization on the fly.
- Windowed Aggregations: Rolling metrics, for example five-minute average transaction volumes.
- Enrichment Lookups: Attach external risk scores or threat indicators from microservices.
- Exactly-Once Semantics: Checkpointing and offset management guarantee no data loss or duplicates.
Schema Registry and Metadata Catalog
A centralized schema registry enforces canonical definitions. Pipelines query the registry to validate incoming records and detect evolutions. A metadata catalog records lineage, capturing which DAGs and scripts generated each dataset. This supports impact analysis and accelerates troubleshooting.
Normalization Rules and Quality Checks
- Referential Integrity: Ensure customer identifiers align with profile tables.
- Range and Pattern Validation: Transaction amounts within thresholds and identifiers matching expected formats.
- Deduplication: Remove repeated events before publishing.
- Null Handling: Apply defaults or filter incomplete records.
Metrics on error rates, throughput and schema mismatches feed monitoring dashboards. Alerts route to operational teams for rapid remediation.
Team Coordination and Governance
- Data Engineers: Design and maintain pipeline logic and connectors.
- DevOps Teams: Provision and scale orchestration infrastructure.
- Risk Analysts: Define normalization requirements and risk categories.
- Security and Compliance Officers: Audit metadata logs and enforce policies.
Regular change-control processes govern schema updates, connector upgrades and pipeline modifications to prevent disruptions.
Error Handling and Recovery
- Automated Retries with Backoff: Isolate transient issues while avoiding resource thrashing.
- Quarantine Queues: Route problematic records for manual inspection.
- Checkpointing: Enable streaming jobs to resume from the last safe state.
- Incident Runbooks: Define escalation paths for batch and streaming failures.
Security and Monitoring
- Access Controls: Role-based permissions for pipeline deployment, data access and schema changes.
- Encryption: Protect sensitive fields in transit and at rest.
- Audit Logs: Capture user actions to satisfy regulatory requirements.
- Operational Metrics: Track latency, success rates, throughput and resource utilization.
Enterprise monitoring tools correlate logs and metrics across the workflow, enabling proactive scaling and tuning.
Handoff to Downstream Analytics
Upon normalization, datasets are published to curated zones in the data lake. Each asset includes:
- Standardized Schemas documented in the catalog.
- Lineage Pointers to sources and transformation scripts.
- Quality Metrics on record validity and completeness.
- Access Policies restricting consumer permissions.
These deliverables feed AI-driven detection engines, informing classification and scoring algorithms in subsequent stages.
Consolidated Data Lake Outputs and Dependencies
The culmination of ingestion, enrichment and normalization is a unified data lake that underpins risk signal detection, model training and real-time monitoring. This repository provides consistent, high-quality and traceable datasets with clear interfaces for downstream consumers.
Key Outputs
- Normalized Transaction and Event Tables: Unified records with timestamp, account IDs, counterparties and metadata ready for risk algorithms.
- Unified Customer Profiles: Versioned identity tables augmented with risk scores and relationship networks, annotated for audit.
- Enriched Threat Feeds: Contextualized external intelligence linked to internal events.
- Metadata Catalog and Data Dictionary: Centralized documentation of schemas, field definitions and lineage.
- Data Quality Scorecards: Periodic reports on completeness, accuracy, uniqueness and freshness.
- CDC Logs: Append-only change data capture streams supporting time-travel queries and backfills.
- Audit and Lineage Artifacts: Execution metrics, source offsets and transformation parameters for full traceability.
Core Dependencies
- Source System Integration: Native connectors, API gateways and CDC streams from transactional platforms and CRMs.
- Orchestration Frameworks: Apache Airflow, AWS Glue, Apache Kafka and Amazon Kinesis coordinate batch and streaming jobs.
- Schema Management: Registries and governance tools such as AWS Lake Formation and Azure Data Lake Storage.
- AI-Driven Profiling and Quality Modules: Engines like Talend Data Quality detect anomalies and suggest cleansing rules.
- Metadata and Lineage Tracking: Open lineage frameworks capture data flow through ETL scripts and AI enrichment services.
Integration with Downstream Stages
Well-defined interfaces ensure seamless handoff to risk signal detection, model training and monitoring workflows:
- Data Access APIs: RESTful and GraphQL endpoints expose parameterized views of unified tables for detection pipelines.
- Versioned Exports: Immutable snapshots in Parquet or ORC for model development, tracked by model registries.
- Streaming Subscriptions: Confluent Platform or Azure Event Hubs topics deliver live events to inference engines.
- Event Bus Notifications: Publish critical changes and quality alerts to trigger investigation or reprocessing workflows.
- Secure Data Sharing: Governed exchange via AWS Data Exchange or Azure Data Share for external collaboration.
By orchestrating ingestion, AI-driven enrichment, rigorous normalization and a robust data lake, financial institutions establish a resilient, scalable foundation for proactive, AI-enhanced risk mitigation.
Chapter 2: Risk Signal Identification
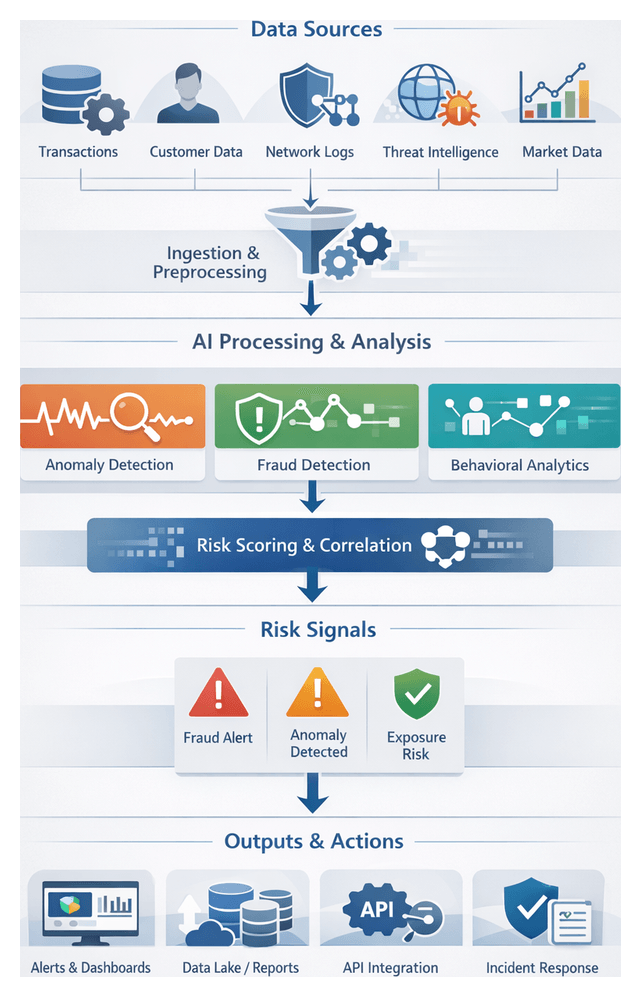
The risk signal identification stage converts raw, normalized data into early indicators of potential fraud, cyber threats, credit exposure, and regulatory infractions. By establishing clear goals and leveraging AI-driven scanning, organizations gain the earliest possible warning of emerging risks, enabling timely mitigation and compliance.
Primary Objectives
- Detect early warning indicators of fraudulent transactions, unauthorized access, or market anomalies
- Identify deviations from behavioral baselines for customers, accounts, and counterparties
- Flag suspicious patterns in network traffic, system logs, and external threat feeds
- Provide structured metadata to support prioritization, scoring, and escalation
- Enable real-time processing to minimize detection latency and support immediate response
Data Inputs, Dependencies, and Prerequisites
Effective signal detection relies on diverse, high-quality inputs, robust infrastructure, and governance compliance. Consistency, completeness, and timeliness are critical to minimize false positives and ensure reliable performance.
Key Data Sources
- Normalized transaction records with timestamps, amounts, currencies, and counterparties
- Customer profiles, KYC attributes, and behavioral baselines
- Network and system logs, intrusion alerts, and API call metadata
- External threat intelligence feeds for indicators of compromise and malicious IPs
- Market data streams, volatility measures, and macroeconomic indicators
- Reference data such as merchant codes, risk ratings, and watchlists
Upstream Dependencies
- Data lake outputs and metadata catalog describing schemas, lineage, and refresh cadences
- AI preprocessing services for parsing, tokenization, and preliminary feature generation
- Feature store updated in real time with behavioral baselines and computed risk factors
- Model registry containing versioned AI artifacts, performance benchmarks, and inference endpoints
- Configuration store for detection rules, thresholds, and parameter settings
Prerequisites for Execution
- Validated ingestion and normalization with automated data quality checks
- Deployment of fine-tuned classification models and feature extractors
- Provisioned compute resources, including GPU or FPGA accelerators
- Secure network segmentation, encryption, and least-privilege access controls
- Regulatory mapping to AML, KYC, PSD2 and documentation for auditability
Signal Scanning and Classification Workflow
This workflow transforms ingested data streams into tagged risk events through segmentation, preprocessing, AI model inference, and enrichment. Modularity and horizontal scaling ensure low-latency analysis across varying throughput demands.
Data Stream Segmentation and Routing
Streams are routed by source, format, and priority via a message broker or streaming platform into specialized scanning modules:
- High-priority transaction streams for real-time monitoring
- User activity logs for behavioral analytics
- Network flow records for intrusion detection
- Threat intelligence feeds for reputation scoring and IOC matching
Preprocessing and Feature Extraction
Preprocessing agents perform cleansing, normalization, and feature engineering:
- Data sanitization, duplicate removal, and format standardization
- Time-window aggregation for rolling statistics
- Sessionization of events to define behavioral contexts
- Encoding categorical fields into numerical or vector representations
- Enrichment with geolocation, device fingerprinting, and watchlist checks
AI-powered preprocessing agents, such as Elastic machine learning modules, adapt feature sets in response to data drift or schema changes.
Classification Engine and Inference
Feature vectors feed into a classification engine that coordinates parallel inference across multiple models:
- Supervised fraud detection classifiers trained on historical cases
- Unsupervised anomaly detectors for deviations from baselines
- Graph-based money laundering detectors leveraging network analysis
- Natural language processing models for communication logs
Frameworks such as Apache Kafka Streams and Microsoft Azure Sentinel analytic rules dynamically select models based on policy and data attributes, yielding probability scores, confidence metrics, and explanatory features.
Risk Tagging, Prioritization, and Correlation
Inference outcomes produce structured risk signal objects enriched with metadata:
- Signal type, confidence score, and contributing features
- Source identifier, timestamp, and enrichment annotations
- Model version, processing environment, and error codes
A prioritization module applies business rules and severity thresholds to rank signals. Correlation engines, such as those in Splunk Enterprise Security, group related events into composite incidents using temporal, entity, and graph relationships.
Orchestration, Scalability, and Continuous Improvement
A centralized orchestration layer manages dependencies, retries, and resource allocation to uphold SLAs and support human-in-the-loop coordination.
Workflow Orchestration and Monitoring
- Define data pipelines in tools like Apache Airflow or IBM Watson Orchestrate, enforcing processing latencies
- Deploy stream processing jobs on Kubernetes with autoscaling policies
- Use service meshes and API gateways for secure, versioned interfaces
- Visualize metrics in Kibana or Grafana dashboards
- Integrate analyst feedback into triage dashboards and ticketing workflows
Adaptive Learning and Feedback Loops
- Collect expert labels on alerts for retraining
- Monitor data drift and model performance to trigger retraining
- Orchestrate retraining with MLflow or Kubeflow
- Present rolling evaluation metrics to identify emerging blind spots
Tagged Signal Outputs and Downstream Handoffs
Tagged signals are enriched, schema-validated artifacts that feed scoring, monitoring, and response systems. They balance contextual richness with lightweight structures for high-throughput transmission.
Output Schema Elements
- Unique identifier, detection timestamp, and source details
- Classification label, confidence score, and model metadata
- Contextual attributes such as transaction amount, geolocation, and watchlist flags
- Enrichment references to threat intelligence providers
- Processing metadata including preprocessing steps and runtime environment
Outputs conform to versioned schemas managed by registries such as Confluent or Azure Event Hubs.
Handoff Patterns
- Real-time streaming via Apache Kafka or Azure Event Hubs for low-latency dashboards
- Batch export to cloud storage or data lakes for ETL into Snowflake or Amazon Redshift
- Synchronous or asynchronous RESTful API calls to scoring and response services
- Message queues like RabbitMQ or Amazon SQS for guaranteed delivery and retry semantics
Operational Best Practices
- Maintain schema compatibility and manage evolution via registry versioning
- Design idempotent consumers to handle duplicates using unique IDs
- Monitor end-to-end latency and throughput against SLOs
- Enforce encryption in transit and at rest, and apply least-privilege access
- Implement dead-letter queues for graceful degradation during outages
- Continuously validate data quality and flag anomalies for resolution
Governance and Compliance
- Define data retention policies aligned with GDPR, PCI DSS, and SOX
- Enforce encryption standards such as AES-256 and TLS 1.2
- Apply role-based access control and data masking for sensitive fields
- Trigger automated regulatory reporting for high-risk categories
By unifying objectives, inputs, AI-driven workflows, and robust handoff mechanisms, organizations can implement a cohesive risk mitigation platform that delivers real-time detection, transparent auditability, and continuous improvement.
Chapter 3: AI Model Training and Validation
Evolving Risk Landscape and Foundational Prerequisites
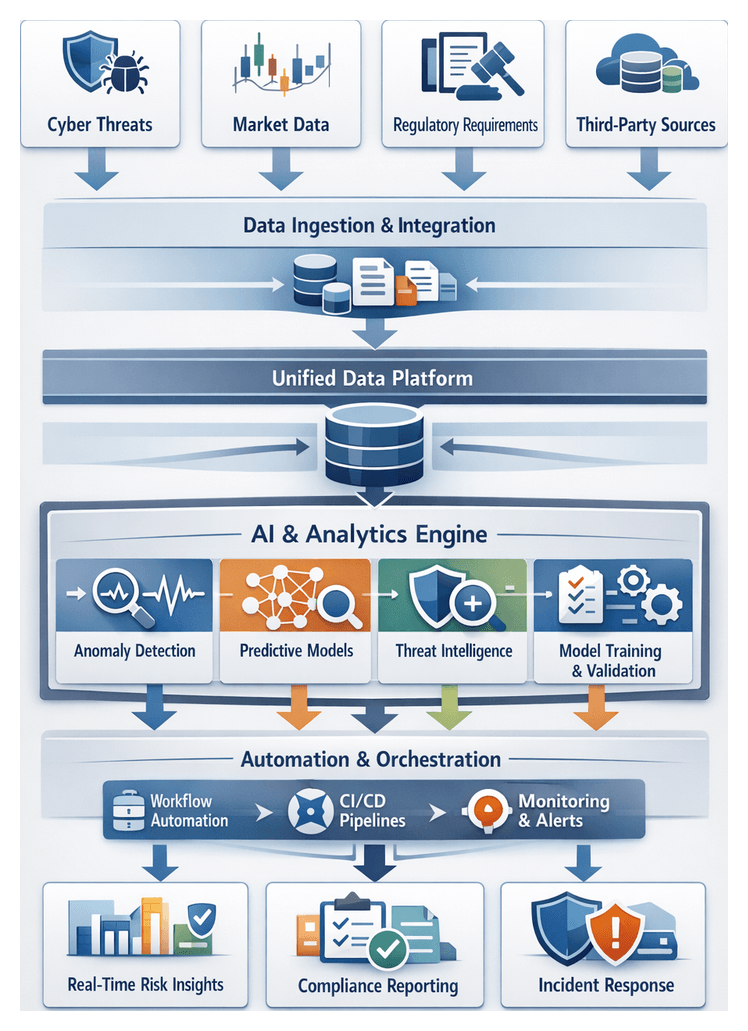
The financial services industry faces an increasingly interconnected array of cyber threats, regulatory mandates, and market dynamics. Advanced fileless malware, AI-driven phishing campaigns, and living-off-the-land attacks demand continuous monitoring and adaptive defenses. Regulatory requirements—from Basel III and GDPR to PSD2—impose stringent reporting controls and force rapid policy updates. Meanwhile, high-frequency trading, digital asset platforms, and global economic volatility expose institutions to liquidity and counterparty risks. The shift toward cloud adoption, open banking, and fintech partnerships further expands the attack surface and introduces complex third-party dependencies.
Traditional siloed risk functions struggle under terabytes of daily log data, fragmented taxonomies, and rule-based systems that generate excessive false positives. Manual compliance reporting amplifies error risks and delays regulatory responses. To address these challenges, firms must adopt a unified, AI-enabled risk framework built on robust data governance, scalable infrastructure, and cross-functional oversight.
Key Drivers of Emerging Risk
- Cyber Threat Evolution: Rapidly evolving adversarial tactics require behavioral analytics and AI-powered detection.
- Regulatory Complexity: Global standards demand precise data lineage and timely audit trails.
- Market Volatility and Operational Strain: Algorithmic trading and macro uncertainty stress liquidity and capacity.
- Digital Transformation and Third-Party Dependencies: Cloud, open banking, and fintech integrations create new failure points.
Operational Implications
- Data Volume and Velocity: Near-real-time ingestion of logs, telemetry, and threat feeds outpaces legacy systems.
- Fragmented Governance: Inconsistent taxonomies hinder prioritization and escalation.
- Escalating False Positives: Rule-based alerts overwhelm analysts and obscure genuine threats.
- Regulatory Reporting Burden: Manual compilation risks non-compliance and fines.
These pressures necessitate an integrated approach that embeds AI across detection, response, and audit workflows. By unifying cyber, compliance, and market risk data, institutions can achieve proactive, real-time risk mitigation.
Prerequisites for AI-Enabled Risk Management
- Data Governance and Quality Controls: Establish ownership, retention, metadata standards, and validation rules.
- Unified Risk Taxonomy: Align terminology, severity scales, and escalation criteria across domains.
- Scalable Data Infrastructure: Deploy high-throughput ingestion platforms such as Apache Kafka and centralized data lakes.
- Interoperable Security and Compliance Tools: Integrate SIEM platforms like Splunk or IBM QRadar via open APIs into orchestration layers.
- Cross-Functional Governance Council: Form a steering committee with representatives from cybersecurity, compliance, risk management, and IT operations.
- Baseline Threat Intelligence: Subscribe to reputable feeds for Indicators of Compromise and vulnerability disclosures.
AI-Driven Model Development and Validation Workflow
Building reliable risk models requires a standardized workflow that bridges data science, experimentation platforms, validation systems, and governance checkpoints. Clear handoffs and metadata tracking ensure consistent evaluation against performance, reliability, and compliance criteria before deployment.
Candidate Model Identification and Architecture Design
Data scientists collaborate with risk analysts and business stakeholders in scoping workshops to define objectives—false positive rates, detection latency, and resource constraints. Historical incident data are reviewed to annotate features and establish target variables. A landscape assessment identifies suitable techniques—gradient boosting, neural networks, or ensemble methods—based on data volume and latency requirements. Lightweight tree-based algorithms often serve real-time needs, while deeper neural models support batch analysis.
- Define modeling goals and key performance metrics.
- Inventory candidate algorithms according to data characteristics.
- Sketch architecture diagrams showing data flow from ingestion to inference.
- Document dependencies on feature stores, compute clusters, and libraries.
Experiment Tracking and Configuration Management
A centralized experiment tracking system records hyperparameters, dataset versions, code commits, and evaluation metrics. Platforms such as MLflow or Weights & Biases capture metadata automatically, enable side-by-side run comparisons, and integrate with continuous integration services to validate code and dependencies. Container images or virtual environments are stored in shared registries to guarantee reproducibility.
- Register experiments with metadata: author, dataset snapshot, code version.
- Enable automated logging of metrics: loss curves, validation accuracy, resource usage.
- Integrate CI pipelines to enforce code quality and dependency compatibility.
- Store container images in a shared registry for reproducible execution.
Cross-Validation and Performance Benchmarking
Unbiased estimates arise from k-fold cross-validation, partitioning data into folds and aggregating performance distributions. Orchestration tools schedule parallel jobs on CPU or GPU clusters, with results visualized on dashboards to detect overfitting or variance issues early.
- Partition datasets into training and validation folds with stratification.
- Execute parallel training jobs using configured container images.
- Aggregate metrics and compute confidence intervals.
- Generate comparative analyses to highlight algorithm strengths and weaknesses.
Hyperparameter Optimization
After establishing baselines, hyperparameter tuning explores parameter spaces through grid search, random search, or Bayesian methods. Libraries like Hyperopt or managed services such as AWS SageMaker Hyperparameter Tuning automate trial execution across distributed compute instances, identifying optimal configurations based on multi-objective criteria.
- Define search spaces for learning rates, tree depths, regularization factors.
- Configure algorithms and stopping criteria to manage runtime.
- Monitor trials via unified dashboards.
- Select parameter sets balancing accuracy and latency.
Explainability and Fairness Assessment
Explainability frameworks such as SHAP and LIME generate feature contribution profiles, while bias assessments test performance across demographic or account segments. Automated scripts compare subgroup metrics to detect disparate impacts and recommend mitigation strategies such as re-sampling or constraint adjustments.
- Embed explainability tools into validation pipelines to produce feature importance reports.
- Define segments for bias evaluation per regulatory guidelines.
- Execute subgroup analyses and document disparities.
- Recommend corrective actions where bias thresholds are exceeded.
Validation Approval and Model Registration
Governance boards comprising risk managers, compliance officers, and senior data scientists review experiment logs, validation metrics, and explainability artifacts. Approved models are registered in centralized registries—such as MLflow Model Registry, Kubeflow Pipelines, Amazon SageMaker Model Registry, or Databricks Model Registry. Each entry includes artifacts, metadata, performance benchmarks, and validation sign-off, with version control ensuring immutability and audit trail integrity.
- Assemble governance packages with logs, metrics, and fairness reports.
- Conduct formal review meetings to capture approval decisions.
- Register approved artifacts and metadata in the model registry.
- Enforce version control for traceable, audited model entries.
AI Orchestration and Platform Capabilities
A robust orchestration layer coordinates resource management, experiment lifecycles, pipeline automation, and governance controls. This backbone enables scalable, compliant, and transparent AI operations within financial institutions.
Resource Management and Automated Provisioning
- Cluster Orchestration: Kubernetes allocates GPU and CPU nodes dynamically.
- Resource Autoscaling: Platforms such as AWS SageMaker and Google AI Platform scale instances based on queue depth.
- Cost Governance: Budget policies and spot instance utilization reduce infrastructure spend.
Experiment Tracking and Reproducibility
- Metadata Capture: MLflow records parameters, metrics, and dataset references.
- Artifact Management: Centralized registries store model binaries and serialized pipelines.
- Version Control Integration: DVC links data and code to experiment IDs for full traceability.
Pipeline Orchestration and Workflow Automation
- DAG Scheduling: Kubeflow Pipelines define sequential and parallel tasks.
- Parameterized Workflows: Templates support automated batch executions across scenarios.
- Integration Hooks: Prebuilt connectors link to data lakes, feature stores, and model registries.
Hyperparameter Tuning
- Grid and Random Search: Parallel trial execution at scale.
- Bayesian Optimization: Azure Machine Learning converges faster on optimal configurations.
- Early Stopping: Prune underperforming runs to allocate resources efficiently.
CI/CD Integration and DevOps Practices
- Automated Testing: Unit tests, data drift checks, and performance benchmarks run on every code commit.
- Containerization: Docker images ensure consistency across environments.
- Pipeline Triggers: Code or data updates invoke CI/CD pipelines to retrain, validate, and promote models.
Monitoring, Alerting, and Drift Management
- Performance Dashboards: Tools like Databricks visualize accuracy, latency, and throughput.
- Data Drift Detection: Statistical tests trigger retraining via predefined thresholds.
- Automated Retraining: Pipelines redeploy updated models upon validation success.
Collaboration, Governance, and Roles
- Data Scientists: Design experiments, select features, and interpret outputs.
- MLOps Engineers: Configure pipelines, manage resource policies, and enforce governance.
- Platform Administrators: Oversee cluster health, security, and cost management.
- Compliance Officers: Review audit logs and registry entries for regulatory adherence.
Model Artifacts, Integration Interfaces, and Operational Hand-off
Validated models produce artifact bundles and metadata that enable real-time risk monitoring and decision support. Clear integration patterns and handoff protocols ensure consistency, traceability, and reliability as models transition from validation to production.
Model Artifact Bundles
- Serialized Weights and Parameters: Formats such as ONNX or Protobuf for interoperability.
- Architecture Definitions: JSON or YAML for frameworks like TensorFlow and PyTorch.
- Preprocessing Pipelines: Exported via scikit-learn or custom modules to ensure consistent feature transformations.
- Container Images: Encapsulate runtime dependencies with Docker and Kubernetes.
- Model Signatures: Define input/output schemas, data types, and validation logic.
Metadata and Performance Reports
- Evaluation Metrics: ROC AUC, precision, recall, F1-score, and calibration curves.
- Confusion Matrices: Contextualize error types for threshold selection.
- Explainability Analyses: SHAP or LIME feature importance reports.
- Drift Baselines: Distribution statistics for incoming features.
- Validation Logs: Cross-validation details, hyperparameter settings, and early stopping criteria.
Model Registry and Version Control
Model registries such as MLflow Model Registry, Kubeflow Pipelines, Amazon SageMaker Model Registry, and Databricks Model Registry serve as authoritative sources for staged rollouts. Each entry includes metadata fields for performance benchmarks, ownership, compliance attestations, and dependency snapshots. Version control ensures all updates, rollbacks, and forks are meticulously tracked.
Integration Interfaces and APIs
- RESTful Microservices: Synchronous scoring of transactions via containerized endpoints.
- gRPC Endpoints: Low-latency, high-throughput inference for mission-critical flows.
- Batch Scoring: Orchestrated by Apache Airflow or Prefect.
- Serverless Functions: Scalable inference via AWS Lambda or Google Cloud Functions.
- Feature Store Integrations: Ensuring runtime parity with stores like Feast or Tecton.
Operational Hand-off to Real-Time Monitoring
- Trigger CI/CD pipelines with Jenkins or GitLab CI to deploy model containers or serverless functions.
- Update routing in API gateways such as Kong or Apigee.
- Register health checks and metrics in Prometheus and Grafana for real-time visibility.
- Rebase data transformation pipelines on validated definitions using Apache Kafka with Flink or Spark Structured Streaming.
- Conduct smoke tests with synthetic or historical transactions to verify end-to-end stability.
Compliance and Audit Documentation
- Versioned Approval Certificates signed by risk and compliance officers.
- Validation Reports aligned with BCBS 239 and SR 11-7, detailing data provenance and bias assessments.
- Immutable Logs of training runs and drift analyses stored in compliance vaults.
- Data Lineage Diagrams from metadata management tools.
- Regulatory Narratives generated by AI reporting engines for auditor submissions.
By centralizing artifact bundles, metadata, and integration interfaces, financial institutions can accelerate time-to-production while maintaining transparency, auditability, and resilience. This structured, AI-enabled framework transforms risk management into a proactive, competitive advantage.
Chapter 4: Real-Time Risk Monitoring
In modern financial services, risk management has evolved from periodic reviews to an uninterrupted, AI-driven capability that continuously safeguards assets, ensures compliance, and accelerates incident response. At its core, real-time risk monitoring aims to ingest diverse operational data streams, detect anomalies within milliseconds, and trigger automated or human-led interventions before events escalate. This always-on posture not only enhances detection speed but also aligns with regulatory mandates such as AML, Dodd-Frank, and PSD2, which require immediate oversight and auditability of transactions and user activities.
The strategic importance of continuous monitoring spans several dimensions:
- Real-time risk detection: Identify fraudulent transactions, insider threats, or market irregularities as they occur.
- Regulatory alignment: Satisfy immediate reporting requirements under AML frameworks and other financial regulations.
- Operational resilience: Lower mean time to detection (MTTD) and response (MTTR) via automated alerting and integration with incident management tools like ServiceNow.
- Data-driven insights: Maintain feedback loops that fine-tune AI algorithms based on live operational data.
- Scalability: Sustain performance during transaction spikes without compromising latency or accuracy.
Establishing this foundation requires a robust environment that addresses data integration, security, and system availability. Key preconditions include a low-latency, high-throughput data pipeline using platforms such as Apache Kafka or Amazon Kinesis, a unified data schema for consistent AI model interpretation, and inference endpoints deployed with tools like TensorFlow Serving. Security measures—TLS encryption, network segmentation, and role-based access controls—must safeguard data in motion and at rest, while observability systems capture metrics on data flow, model latency, and system health. Defining service-level agreements for end-to-end latency, availability, and data loss thresholds aligns cross-functional teams around performance targets and ensures accountability.
Core Data Streams and Governance
A comprehensive risk monitoring solution relies on a rich tapestry of real-time data sources. Streamed into a unified analytics fabric, these feeds empower AI engines to correlate disparate events and surface high-confidence alerts. Primary data categories include:
- Transaction Streams: Retail and wholesale payments, fund transfers, card authorizations, and wire transactions, enriched with timestamps, identifiers, amounts, and geolocation.
- Network and Infrastructure Logs: Firewall records, proxy logs, DNS queries, and system access events that reveal lateral movements or data exfiltration attempts.
- User and Entity Behavior Analytics (UEBA): Authentication events, session telemetry, and device fingerprints that detect insider threats and account takeovers.
- Market and External Data: Real-time market feeds, macroeconomic indicators, and sentiment analysis that contextualize trading risks.
- Threat Intelligence Feeds: Indicators of compromise from services like Recorded Future and open sharing platforms, integrated to enrich internal logs.
- Application and Middleware Metrics: Performance measures, queue depths, and error rates that flag operational anomalies or attack vectors.
- Regulatory and Audit Events: Policy updates, access reviews, and audit logs from compliance systems.
High-fidelity analysis demands rigorous data quality and governance practices. Ingress validation rules must enforce schema compliance and time synchronization, typically via NTP, to ensure accurate event ordering. Enrichment services augment raw feeds with customer risk profiles, geographic risk scores, and transaction purpose codes, while privacy controls anonymize or tokenize personally identifiable information in accordance with GDPR and CCPA. Recording lineage metadata enables end-to-end traceability, bolstering trust in automated risk assessments. Security and compliance preconditions—such as encrypted transport, least-privilege IAM policies, audit trails of configuration changes, data retention policies, and regular vulnerability assessments—provide the foundation for reliable and defensible continuous monitoring.
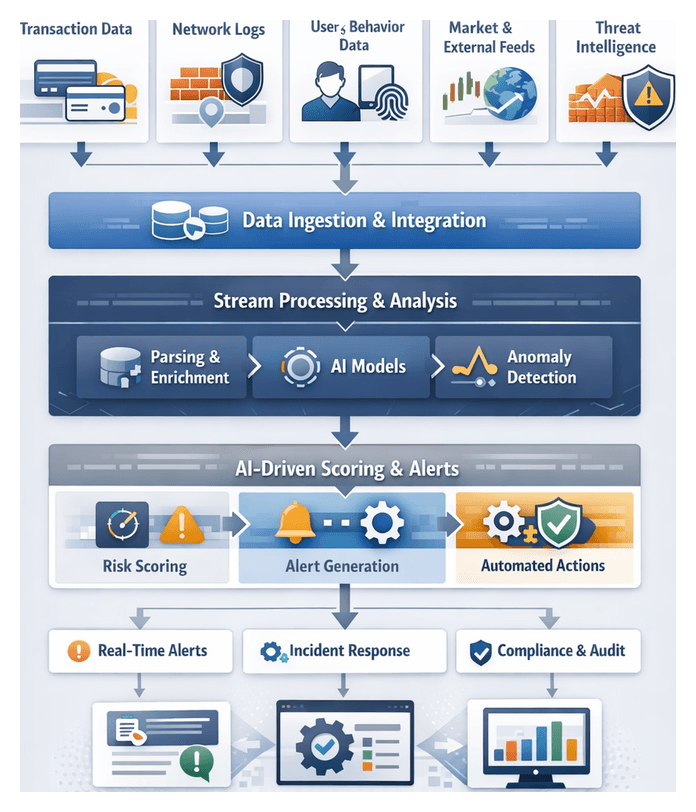
Stream Processing and Alert Generation
Transforming high-velocity event streams into actionable alerts involves a coordinated sequence of ingestion, enrichment, analytics, and routing processes. This stage leverages scalable streaming platforms, AI modules, and complex event processing to ensure that risk signals are prioritized and delivered without delay.
Data Ingestion and Partitioning
Event sources—from core banking systems and network telemetry to web application logs and threat intelligence—feed into message buses such as Confluent Platform or Amazon Kinesis. Key considerations include schema evolution management, idempotent producers to avoid duplicates, partitioning by attributes like account ID or geolocation, and transport encryption.
Parsing, Normalization, and Enrichment
Raw records in JSON, XML, or binary formats are parsed into a canonical schema. AI-powered parsers apply named entity recognition to extract critical fields, after which enrichment layers augment events with contextual metadata—geolocation risk scores, device fingerprint reputations, and recent anomaly indicators from centralized data stores.
Streaming Analytics Frameworks
Enriched events flow into frameworks such as Apache Flink or Apache Spark Streaming. These engines execute stateless and stateful operations—sliding windows, session aggregations, temporal joins—and real-time complex event processing that flags patterns like rapid failed logins or unusual fund transfers.
AI-Driven Scoring and Alert Logic
Low-latency inference services score events across fraud likelihood, compliance risks, and cybersecurity threats. Models—ranging from gradient boosted trees to neural networks—are served via APIs on inference clusters with auto-scaling. When scores exceed thresholds, alert generation modules encapsulate the event into structured payloads containing unique identifiers, processing lineage, feature contributions, severity levels, and recommended playbooks.
Orchestration, Fault Tolerance, and KPIs
A central orchestrator prioritizes alerts using rule engines that escalate high-value accounts or sanction matches and group related signals to reduce noise. Alerts are delivered to incident platforms, message queues, or notification channels with retry logic, dead-letter queues, and replay capabilities to prevent data loss. Operational teams monitor KPIs such as event-to-alert latency, throughput, false-positive rates, and uptime via dashboards built on Grafana or Kibana, enabling continuous optimization of resource allocation and processing logic.
Live AI Inference Architectures and Integration
Live inference engines convert streaming data into instant risk predictions, forming a critical bridge between data ingestion and alerting workflows. These systems must balance millisecond-level response times with high throughput, resilience, and auditability.
Inference Serving Platforms
Specialized model servers such as TensorFlow Serving, NVIDIA Triton Inference Server, and lightweight runtimes like ONNX Runtime deliver optimized runtimes supporting gRPC, REST, GPU acceleration, and dynamic batching. Managed services—Amazon SageMaker Endpoints or Google Cloud AI Platform Prediction—abstract infrastructure concerns while enforcing autoscaling and health checks.
Streaming Integration Patterns
- Pull-based invocation within Apache Flink or Apache Spark Streaming, where event batches call inference endpoints synchronously.
- Push-based publishing to topics in Apache Kafka or Confluent Platform, with consumers enriching and routing predictions.
- Serverless execution via AWS Lambda or Azure Functions triggered by streams in Amazon Kinesis or Azure Event Hubs.
Trade-offs among patterns involve considerations of throughput, latency, backpressure resilience, and operational complexity. Selection hinges on acceptable latency, fault tolerance, and platform expertise.
Model Versioning and Governance
Continuous evolution of AI models demands robust version control and canary deployment strategies. Semantic versioning of artifacts in registries like MLflow allows attributes such as feature schemas, training data snapshots, and performance metrics to be tracked. Traffic splitting directs a portion of live data to candidate models for drift analysis and false-positive monitoring, with automated rollback upon deviation from predefined health thresholds.
API Interfaces and Security
Inference endpoints expose REST or gRPC APIs secured with mutual TLS, OAuth 2.0, or token-based schemes. Protocols accommodate JSON, Avro, or Protocol Buffers payloads, while role-based authentication and rate limiting prevent unauthorized or excessive access. Audit logs capture every request and response, including timestamps, model versions, and metadata, supporting regulatory audits under Basel III, GDPR, and PSD2.
Scalability, Availability, and Monitoring
Container orchestration on platforms like Kubernetes enables horizontal autoscaling of inference pods based on CPU, GPU, or custom metrics such as request latency. Service meshes (Istio, Linkerd) implement load balancing, retries, and circuit breaking. Multi-region deployments ensure geographic resilience, with state store replication for consistent predictions. Telemetry—latency percentiles, throughput metrics, error rates, and input drift detection—feeds back into MLOps pipelines, triggering retraining or capacity adjustments.
Visualization, Alert Handoffs, and Operational Oversight
The final stage translates AI outputs into actionable intelligence via monitoring dashboards and structured alert payloads. These deliver situational awareness to security operation centers, compliance teams, and executives, while enabling automated workflows to contain threats and satisfy audit requirements.
Dashboard Metrics and Tools
Dashboards consolidate time-series risk scores, anomaly rates, and system health metrics into visual formats such as line charts, heatmaps, and top-n lists. Platforms like Splunk, Kibana, Tableau, and Microsoft Power BI support real-time updates through streaming indexes or in-memory stores, while drill-down tables enable analysts to explore event context.
Alert Structures and Delivery Channels
Structured alerts include unique identifiers, timestamps, risk and anomaly scores, contextual metadata (account IDs, device fingerprints, IP addresses), model explanations, and recommended escalation paths. Payloads are serialized in JSON or Avro to ensure compatibility with downstream systems. Handoff mechanisms include:
- Message queues (Apache Kafka, RabbitMQ) streaming alerts to security orchestration tools
- RESTful APIs consumed by SOAR platforms such as ServiceNow
- Email, SMS gateways for critical notifications
- Webhooks to ticketing and collaboration systems
- Database writes for audit and compliance repositories
Reliability, Auditability, and Access Control
High-availability clusters, replicated data pipelines, and real-time monitoring of end-to-end latency ensure service-level objectives are met. Immutable logs of alerts, dashboard snapshots at reporting intervals, and access logs detailing user interactions support AML, KYC, and other compliance programs. Role-based access controls grant security analysts detailed drill-downs, compliance officers aggregated views without PII, and executives strategic scorecards. APIs and dashboards remain extensible to accommodate new threat scenarios, visualization types, and integration endpoints.
By orchestrating these monitoring outputs with clearly defined handoff protocols and governance guardrails, financial institutions achieve a proactive, AI-driven risk management framework. Continuous feedback loops—from incident outcomes, telemetry analysis, and user interactions—drive iterative enhancements, ensuring that risk detection and response capabilities evolve in concert with emerging threats and regulatory demands.
Chapter 5: Anomaly Detection and Alerting
Anomaly detection establishes the criteria and inputs necessary to identify deviations from expected behavior in financial operations. By defining clear detection parameters and readiness conditions, organizations ensure high-fidelity signals for alert generation, minimize false positives, accelerate response times, and maintain an auditable framework aligned with regulatory mandates. Shifting from static, rule-based systems to adaptive, AI-driven models enables real-time risk mitigation that scales with transaction volumes, system logs, network flows, and user behavior data.
Effective anomaly detection aligns technical capabilities with business objectives and compliance requirements, supports continuous performance measurement, and integrates consistently with alert management and incident response workflows. In fast-moving markets where delays can incur significant financial and reputational losses, a structured detection stage delivers timely, accurate, and governance-ready risk signals.
Detection Criteria and Data Inputs
Detection criteria encompass the rules, thresholds, and statistical models that distinguish normal activity from anomalies:
- Behavioral Baselines – Statistical representations of transaction amounts, frequencies, geolocations, and channel usage over defined windows.
- Deviation Measures – Metrics such as standard deviation, clustering distances, and density estimates that quantify divergence from baselines.
- Contextual Filters – Business logic or policy constraints, for example excluding internal maintenance transactions or whitelisted entities.
Required Data Inputs
- Transaction Streams – Real-time feeds of payments, wire transfers, ATM withdrawals, and authorizations with timestamps, amounts, account IDs, merchant details, and channel codes.
- User and Account Profiles – Demographics, risk tiers, historical summaries, and relationship attributes enabling stratified baselining.
- Network and System Telemetry – Logs from authentication services, VPN gateways, database monitors, and endpoint agents revealing unusual access or exfiltration patterns.
- External Threat Intelligence – Indicators of compromise, known malicious IPs, botnet signatures, and fraud ring watchlists enhancing anomaly prioritization.
- Environmental Metadata – Market events, holidays, regulatory embargoes, and maintenance windows to adjust expected activity baselines.
Enriched features—transaction velocity, inter-account linkages, entity graphs, and device fingerprints—support unsupervised learning approaches and reduce detection latency.
Prerequisites and Operational Readiness
To guarantee data quality, model readiness, and operational alignment, anomaly detection must be underpinned by:
- Data Normalization – Harmonized schemas, units, and time zones via streaming frameworks with connectors.
- Feature Store Access – Precomputed rolling averages, z-scores, cluster assignments, and centrality measures loaded into a low-latency feature repository.
- Baseline Model Deployment – Unsupervised engines (autoencoders, isolation forests) and statistical engines deployed for inference, reflecting the latest training cycles.
- Threshold and Policy Definitions – Documented risk thresholds, alert severities, and escalation rules managed in a policy repository.
- Observability Infrastructure – Streaming platforms, message queues, and monitoring agents capturing inference metrics, detection latencies, and error rates.
Governance foundations include data lineage documentation, role-based access controls compliant with GDPR and CCPA, data masking or tokenization, and scheduled audits for completeness and consistency.
Operational alignment spans risk committees, data scientists, compliance and legal reviews, and IT/DevOps coordination to provision inference services, manage deployment pipelines, and ensure high availability.
Clear handoff conditions to alert generation require anomaly records enriched with timestamps, model identifiers, feature values, deviation scores, confidence indicators, audit trail entries, and routing instructions for downstream systems.
Detection Workflow Overview
The anomaly detection workflow orchestrates multiple systems to identify deviations, score their significance, and generate actionable alerts. Normalized event streams feed detection microservices that retrieve feature definitions from a feature store such as Feast and model artifacts from registries like MLflow or Kubeflow.
Data Flow and System Interactions
- Ingestion – Normalized streams of transaction logs, network flows, and user activities published to Apache Kafka or Amazon Kinesis.
- Feature Retrieval – Detection services query centralized stores for feature schemas and model artifacts.
- Inference Execution – Low-latency engines process events in real time; GPU clusters with NVIDIA Triton Inference Server scale for high throughput.
- Score Calculation – Raw model outputs normalized and calibrated against dynamic thresholds from HashiCorp Consul or AWS Parameter Store.
- Alert Construction – Orchestrators compile alert objects including entity IDs, timestamps, anomaly scores, confidence metrics, and feature contributions.
- Dispatch – Alerts sent to management systems such as Splunk, IBM QRadar, or Microsoft Sentinel.
Anomaly Scoring Sequence
- Score Normalization – Universal function rescales raw outputs into a fixed range (e.g., 0–100).
- Dynamic Thresholds – Adapt to time-of-day, volume, and incident rates using InfluxDB or Amazon Timestream.
- Confidence Calibration – Methods like isotonic regression or Platt scaling produce reliability measures.
- Feature Attribution – Explainability via SHAP library highlights top contributing factors.
- Metadata Enrichment – Append geolocation, device fingerprint, and risk profiles using AI APIs.
Alert Generation, Prioritization and Integration
Alert Generation and Prioritization
- Typing – Categorize by risk domain (fraud, compliance breach, system abuse) via rule engines or classification models.
- Prioritization – Compute composite scores combining anomaly severity, confidence, business impact weightings, and user risk.
- Dependency Correlation – Cross-reference active incidents using Elastic Stack for chain detection.
- Deduplication – Collapse similar alerts into single tickets with aggregated counts.
Integration with Alerting Platforms
- API Handoff – RESTful or message queue delivery to PagerDuty, ServiceNow, or Datadog using OpenC2 schemas.
- Webhooks – Push notifications to Slack or Microsoft Teams for real-time visibility.
- Dashboards – Populate Grafana or Kibana widgets showing alert volume, severity, and time-to-detect.
- Audit Logging – Record all events in immutable stores like AWS QLDB for traceability.
Coordination with Response Teams
- Ticket Generation – Auto-create incidents with full alert context and unique identifiers.
- Escalation Protocols – Playbook-driven rules trigger tiered escalations based on time and severity.
- Orchestration Hooks – Webhooks to SOAR platforms like Palo Alto Networks Cortex XSOAR or Splunk SOAR automate response actions.
- Analyst Acknowledgment – Analysts review and update incident status; orchestration engines log actions to maintain state.
- Feedback Loop – Outcomes, including false positives or confirmed breaches, feed back into model training and threshold adjustments.
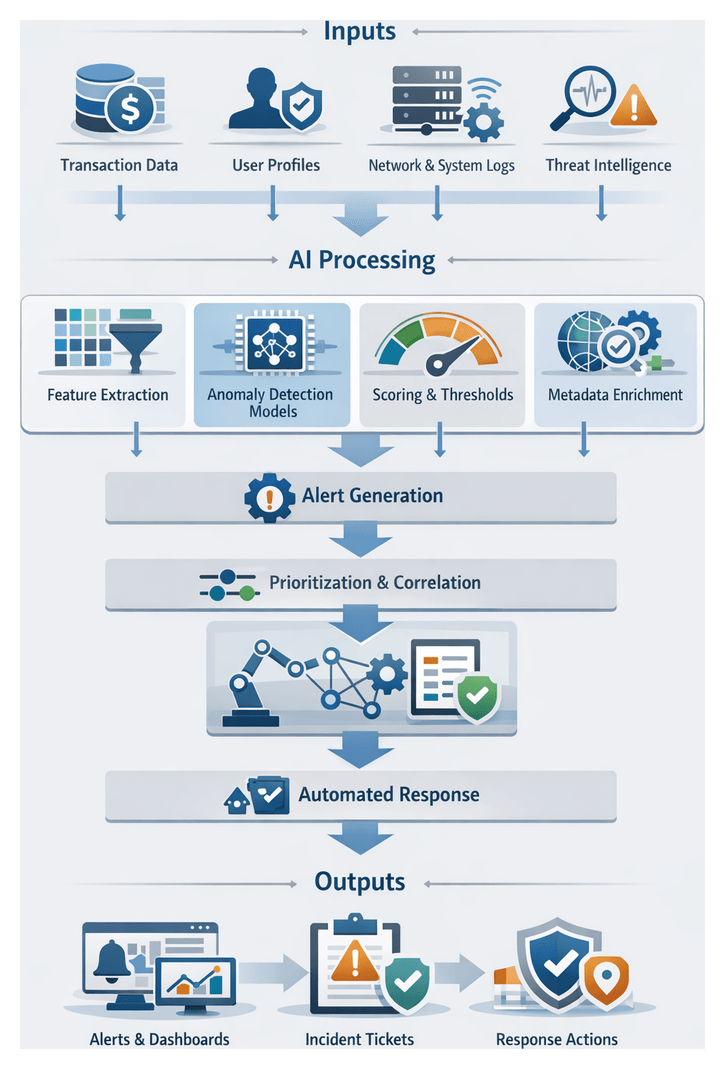
AI-Driven Risk Mitigation Architecture
AI integration embeds machine learning models, automation engines, and supporting infrastructure across the risk management workflow. By combining predictive analytics, unsupervised learning, natural language processing, and robotic process automation, institutions shift from reactive defenses to proactive threat anticipation.
Core AI Capabilities
- Data Ingestion and Preprocessing – Schema inference, normalization, entity resolution, and semantic tagging via platforms like Snowflake and Databricks.
- Predictive Analytics – Supervised models (logistic regression, random forests, gradient boosting) orchestrated in AWS SageMaker and Azure Machine Learning.
- Unsupervised Anomaly Detection – Clustering, autoencoders, and isolation forests prototyped in TensorFlow and managed via MLflow.
- Natural Language Understanding – Sentiment analysis, entity extraction, and compliance mapping with Google Cloud AI Platform.
- Automated Decision Engines – Business logic and RPA workflows orchestrated by UiPath and Workato to execute holds, notifications, or referrals.
Supporting System Roles and Integration Layers
- Data Management – Central repositories in Snowflake or Amazon Redshift with metadata catalogs for lineage and quality.
- MLOps Pipelines – Experiment tracking, versioning, and model deployment via Kubeflow and MLflow.
- Streaming Layers – Low-latency ingestion in Apache Kafka or Amazon Kinesis with on-the-fly inference.
- API Management – Gateways enforcing authentication, authorization, and rate limits for risk insight consumption.
- Compliance and Logging – Immutable audit trails via ledger databases ensuring verifiable action histories.
Synergy Between AI and Supporting Systems
- Detection Speed – High-throughput Kafka pipelines and GPU-accelerated serving detect threats in milliseconds.
- Accuracy – Continuous retraining on feedback data reduces false positives, guided by data management quality rules.
- Scalability – Containerized services on Kubernetes enforce data residency and multi-tenant policies.
- Explainability – Interpretability frameworks expose feature importances for audits and analyst insight.
- Governance – Policy engines validate compliance, trigger human reviews on deviations, and archive all decisions.
This integrated architecture delivers regulatory acceleration, operational efficiency, enhanced risk posture, and continuous adaptability to emerging threats.
Alerts Output and Escalation Dependencies
Overview of Alert Outputs
Anomaly detection produces structured alerts enriched with metadata, severity ratings, and escalation directives. Key components include a unique identifier, UTC timestamp, source context, normalized anomaly score, severity level, alert type, supporting evidence, suggested actions, and escalation routing. Embedding quantitative metrics and qualitative context enables both automated orchestration and clear guidance for human investigators.
Alert Data Structure and Metadata
- Schema Version – Ensures backward compatibility as fields evolve.
- Event Context – Nested fields like user location, device fingerprint, transaction amounts, and threat intelligence tags.
- Model Metadata – References to model version, training snapshot, and performance metrics.
- Correlation Keys – Attributes linking alerts to related events in SIEM or fraud platforms.
- Audit Trail – Timestamps, service identifiers, and processing latency for compliance reporting.
- Escalation Matrix – Pointers to policies defining pathways by severity, region, or business unit.
Escalation Dependencies and Integration
- Streaming Platform – Real-time routing via Apache Kafka or cloud event services.
- SIEM – Ingestion into Splunk Enterprise Security or IBM QRadar for correlation and compliance reporting.
- Ticketing – Automated incident creation in ServiceNow or JIRA Service Management based on severity mapping.
- Notifications – Delivery via email gateways, SMS APIs, Slack, or Microsoft Teams to on-call responders.
- Access Control – Identity management integration for immediate user interventions like MFA or password resets.
Handoff Mechanisms to Incident Response
- Publish/Subscribe – Alerts published to topics; multiple consumers subscribe for parallel processing.
- API Push – Synchronous delivery via RESTful endpoints with acknowledgements and correlation tokens.
- Batch Export – Aggregated CSV or JSON uploads for offline reporting and trend analysis.
- Webhooks – HTTP callbacks trigger automated playbooks in orchestration platforms.
- Database Writes – Direct storage in SQL or NoSQL for BI tool queries and custom dashboards.
Operational Considerations and Best Practices
- Schema Governance – Formal version control and change management for alert schemas.
- Health Monitoring – Dashboards and health checks for message buses, SIEM connectors, and APIs.
- SLAs – Defined throughput and latency targets for high-severity alerts.
- Escalation Playbooks – Role-based mappings of severities to response teams and actions.
- Redundancy and Failover – Dual brokers and parallel endpoints to avoid single points of failure.
- Periodic Testing – Simulations and tabletop exercises to verify end-to-end alerting and escalation.
- Feedback Integration – Incident outcomes update thresholds and models to continuously refine detection accuracy.
Chapter 6: Automated Risk Assessment and Scoring
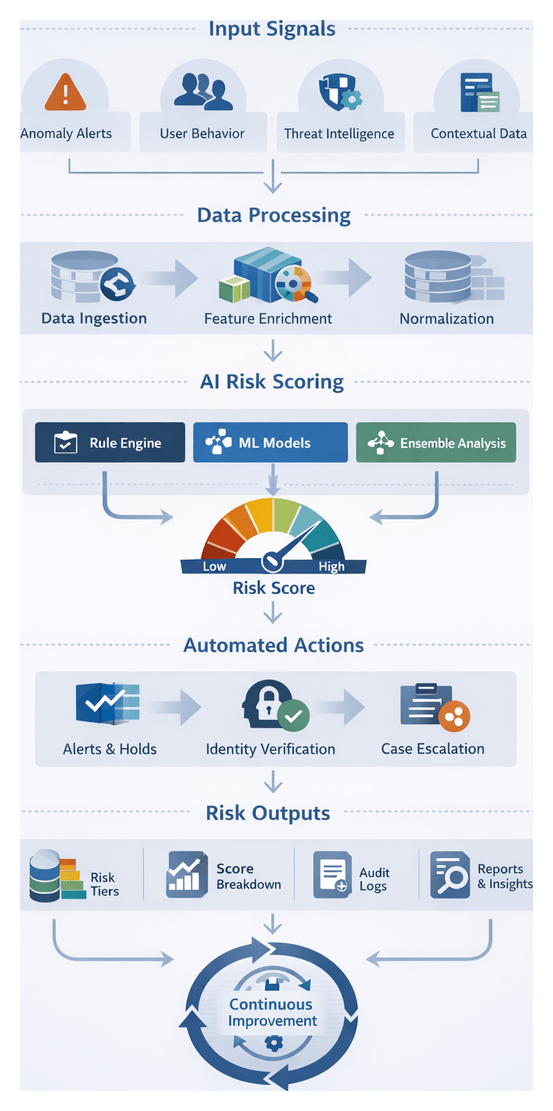
Scoring Framework Objectives and Workflow Overview
Automated risk aggregation and scoring is the analytical core of an AI-driven risk mitigation workflow. It consolidates heterogeneous risk signals—from anomaly alerts and user behavior metrics to external threat intelligence—into a single, quantifiable score. This unified risk metric enables consistent evaluation across business units, supports real-time prioritization of alerts, and triggers automated responses in accordance with organizational policies. By embedding explainability and auditability into scoring, institutions can demonstrate compliance with regulatory requirements and maintain stakeholder trust.
In a landscape characterized by sophisticated cyberattacks, evolving compliance mandates, and volatile market conditions, a coherent scoring framework prevents fragmented risk assessments and delayed responses. The objectives of this stage are to:
- Standardize threat severity quantification to deliver consistent risk evaluations across diverse systems and events.
- Prioritize incidents by impact, likelihood, and risk appetite to focus resources on high-value threats.
- Automate decision triggers—such as transaction holds, identity verifications, or case escalations—via predefined thresholds.
- Generate auditable reports with transparent scoring methodologies for regulators, auditors, and internal teams.
- Provide interpretability through explainable metrics and factor breakdowns that analysts can trust and act upon.
Successful execution requires seamless integration with upstream data ingestion, signal identification, model training, real-time monitoring, and downstream response orchestration. Together, these components form an end-to-end mechanism for proactive risk management, continuous improvement, and regulatory alignment.
Input Signals and Data Quality Requirements
The integrity of risk scores depends on high-quality input signals and contextual data. Key sources include:
- Normalized Risk Signals: Classified event tags produced by the signal identification stage, such as failed login attempts or policy violations.
- Anomaly Detection Outputs: Quantitative deviation scores from unsupervised models flagging outliers in transaction volumes or user behavior.
- Contextual Attributes: Customer profiles, account histories, device fingerprints, geolocation data, transaction metadata, and session details.
- External Threat Intelligence: Curated feeds and vulnerability reports from Recorded Future and frameworks like MITRE ATT&CK.
- Model Confidence Metrics: Probability estimates and calibration scores that guide weighting in composite calculations.
- Regulatory Parameters: Predefined thresholds, tier definitions, and policy constraints aligned with internal risk appetite and compliance frameworks.
- Historical Analytics: Aggregated incident outcomes and past scores serving as references for calibration and trend analysis.
- Environmental Context: Market volatility indices, system maintenance schedules, and live threat alerts that influence dynamic evaluations.
To ensure trustworthiness, input data must meet stringent quality and availability conditions:
- Completeness: All required fields and features must be present and populated across datasets.
- Accuracy: Data values validated through reconciliation routines, schema checks, and anomaly detection in ingestion pipelines.
- Freshness: Near real-time ingestion and processing to capture current risk landscapes with minimal latency.
- Consistency: Harmonized formats, units, and taxonomies achieved via normalization and schema mapping.
- Traceability: End-to-end lineage tracking that records data origin, transformation steps, and model inputs for audit purposes.
- Security: Role-based permissions, encryption in transit and at rest, and secure transmission channels.
- Regulatory Alignment: Compliance with GDPR, CCPA, PCI DSS, and other data protection regulations in data handling and storage.
Technical and Organizational Prerequisites
Establishing a robust scoring stage requires both a solid technical foundation and enterprise-wide alignment:
- Unified Data Platform: Scalable, high-performance repositories such as Snowflake or modern lakehouse architectures to store and query normalized data.
- Stream Processing Framework: Real-time pipelines powered by Apache Kafka or AWS Kinesis to ingest continuous event streams.
- AI/ML Infrastructure: Model development and serving environments such as Amazon SageMaker, H2O.ai, or Google Cloud AI Platform for hosting, versioning, and scaling algorithms.
- Workflow Orchestration: Engines like Apache Airflow or Kubeflow Pipelines to schedule and manage end-to-end tasks, dependencies, and retries.
- Risk Score Registry: A centralized artifact store to register scoring configurations, model metadata, and versioned pipelines for reproducibility.
- Integration APIs: Secure RESTful interfaces for receiving normalized signals and returning computed risk scores to downstream systems.
- Monitoring and Logging: Observability platforms like Splunk, the ELK Stack, Prometheus, and Grafana to track throughput, latency, errors, and drift.
- Security Frameworks: Identity management and single sign-on via Okta, combined with encryption and access controls.
- Governance and Audit Tools: Policy enforcement platforms to validate scoring configurations, maintain audit trails, and manage stakeholder approvals.
Organizational prerequisites include documented risk appetite statements, cross-functional collaboration among risk, data engineering, compliance, and IT teams, comprehensive training programs, change management processes for model updates, and incident response playbooks triggered by risk thresholds. Regular performance reviews and recalibration cycles ensure the framework adapts to emerging threats and evolving regulatory expectations.
Core Aggregation and Scoring Process
The aggregation and scoring pipeline converts upstream signals into actionable risk profiles through a coordinated sequence:
- Data Retrieval: Query normalized event streams and anomaly detection outputs from the data lake or feature store.
- Contextual Enrichment: Append customer attributes, geolocation data, device details, and historical risk trends via microservices.
- Normalization: Map disparate metrics to a common scale to ensure compatibility across scoring models.
- Rule-Based Aggregation: Apply explicit business logic—implementable via engines such as Drools or OpenRules—to assign base weights reflecting policy mandates and compliance rules.
- Algorithmic Scoring: Invoke AI models, including supervised classifiers, ensemble learners, graph-based networks, and probabilistic methods, to compute composite risk scores.
- Tier Assignment: Map numerical scores to categorical tiers (low, medium, high, critical) for rapid prioritization and routing.
- Persistence and Distribution: Store finalized scores with metadata in the risk repository and disseminate via REST APIs, message streams, or batch exports.
Orchestration frameworks ensure task dependencies and retries. Real-time inference runs on platforms such as TensorFlow Serving or NVIDIA Triton Inference Server, auto-scaled by Kubernetes. Batch scoring, for end-of-day or portfolio analyses, is managed by Apache Airflow. A message broker like Apache Kafka distributes events to fraud detection consoles, case management systems, and response orchestrators, enabling parallel, low-latency reactions.
AI Scoring Methods and System Components
Achieving high accuracy and adaptability requires a layered AI architecture and supporting systems:
- Supervised Classification: Logistic regression, random forests, gradient boosting machines, and deep neural networks translate labeled risk events into probability scores.
- Ensemble Learning: Techniques such as bagging, boosting, and stacking combine multiple models to reduce variance and improve generalization.
- Graph-Based Scoring: Graph convolutional networks and relational embeddings analyze entity relationships to detect collusive patterns and money laundering networks.
- Bayesian Models: Incorporate prior risk knowledge and update posterior probabilities as new evidence arrives, enhancing explainability by tracing belief shifts.
- Unsupervised Methods: Autoencoders, clustering, and one-class SVMs establish behavioral baselines, where deviations generate anomaly scores for hybrid integration.
- Hybrid Rule-AI Systems: Deterministic rules encoded in human-readable formats work alongside AI outputs to enforce hard thresholds and contextual overrides.
These algorithms rely on the following system components:
- Feature Store: Solutions like Feast manage versioned feature repositories, enabling consistent online and offline access for training and real-time inference.
- Inference Engines: TensorFlow Serving and NVIDIA Triton host serialized models and provide low-latency REST or gRPC endpoints, auto-scaled via Kubernetes.
- Model Registry: Tools such as MLflow archive model binaries, code, performance metrics, and support promotion workflows and rollbacks under governance controls.
- Business Rules Engine: Engines like Drools or OpenRules enforce regulatory thresholds and context-based overrides in an auditable, human-readable format.
- Workflow Orchestration: Apache Airflow, Kubeflow Pipelines, and Prefect coordinate end-to-end pipelines—from data ingestion and feature computation to model inference and alert generation.
- API and Integration Layer: RESTful endpoints, message queues, and webhooks expose risk scores, explanatory feature attributions, and confidence metrics to downstream systems under strict authentication and authorization controls.
- Explainability Modules: SHAP, LIME, and decision path visualizations decompose model outputs into feature contributions, while natural language summaries assist analysts and regulators.
- Monitoring and Feedback: Prometheus, Grafana, and custom dashboards track drift indicators, latency, throughput, and error rates. Feedback from incident outcomes feeds into retraining pipelines, closing the continuous improvement loop.
Risk Score Outputs and Downstream Integration
The scoring stage produces a comprehensive set of artifacts that serve as the foundation for decision support and regulatory reporting:
- Normalized Risk Score: A unified numeric value (e.g., 0–100) representing threat severity.
- Score Breakdown: Detailed weightings of rule-based contributions and model feature importances.
- Confidence Metrics: Indicators of prediction reliability and data quality.
- Traceability Links: References to original signals, anomaly outputs, and model versions.
- Risk Tier Classification: Categorical labels (low, medium, high, critical) for rapid routing.
- Audit Metadata: Timestamps, version identifiers, and processing logs.
Delivery mechanisms include RESTful APIs for synchronous queries, message streams (Apache Kafka, cloud Pub/Sub) for event-driven distribution, secure file exports (encrypted CSV or Parquet) for batch reconciliation, and direct writes to data warehouses for consolidated reporting. Downstream systems—case management platforms, real-time monitoring dashboards, automated response orchestrators, and compliance modules—consume these outputs to:
- Generate natural language recommendations and investigative support.
- Trigger transaction holds, customer verifications, and incident escalations.
- Visualize risk exposures and trend analyses in operational dashboards.
- Compile audit trails and regulatory submissions in compliance data marts.
- Ingest feedback from investigations and adjust models via retraining.
Best Practices and Operational Considerations
To maintain a resilient, transparent, and compliant scoring framework, financial institutions should:
- Monitor End-to-End Performance: Track processing latency, throughput, error rates, and data freshness across scoring pipelines and downstream integrations.
- Ensure Auditability: Maintain immutable logs that capture every scoring request, input signals, model version, and resulting score. Link logs to compliance archives and incident investigations.
- Govern Features and Models: Enforce approval workflows for changes to feature definitions, scoring algorithms, and weighting factors. Document business rationales and regulatory impact assessments.
- Implement Role-Based Access: Restrict access to sensitive data fields and scoring configurations. Apply data masking and encryption as needed.
- Design for Scalability and Resilience: Use horizontal scaling, auto-scaling policies, failover clusters, and dead-letter queues to handle peak loads and transient errors with graceful degradation.
- Synchronize Environments: Automate provisioning of development, testing, and production scoring configurations via infrastructure as code to prevent drift.
- Maintain Continuous Improvement: Establish feedback loops where incident outcomes, analyst adjustments, and performance metrics feed back into model retraining and rule refinement.
Real-World Transaction Scoring Example
Consider a high-volume payment platform that scores each transaction in real time. As transaction data streams in, the scoring engine computes:
- A risk score of 82 on a 0–100 scale.
- A breakdown indicating 60% weight from unusual transaction velocity, 25% from device fingerprint mismatch, and 15% from external fraud feed alerts.
- A confidence metric of 0.93, reflecting strong feature coverage and model calibration.
- Trace identifiers linking back to signals processed one second earlier.
- A “High Risk” tier classification triggering an immediate hold.
Upon score publication:
- The orchestration engine invokes a transaction hold and routes the case to a verification workflow.
- The real-time monitoring dashboard updates heat maps showing spikes in device-based anomalies.
- The compliance reporting module logs the high-risk event in the daily audit file.
- The recommendation engine generates natural language advisories, suggesting a two-factor authentication step.
All actions reference the original score payload, enabling complete post-mortem analysis and feeding labeled outcomes back into the training datasets. This end-to-end design ensures that algorithmic insights translate into decisive operational responses, strengthening the institution’s security posture and compliance readiness.
Chapter 7: Decision Support and Recommendation Generation
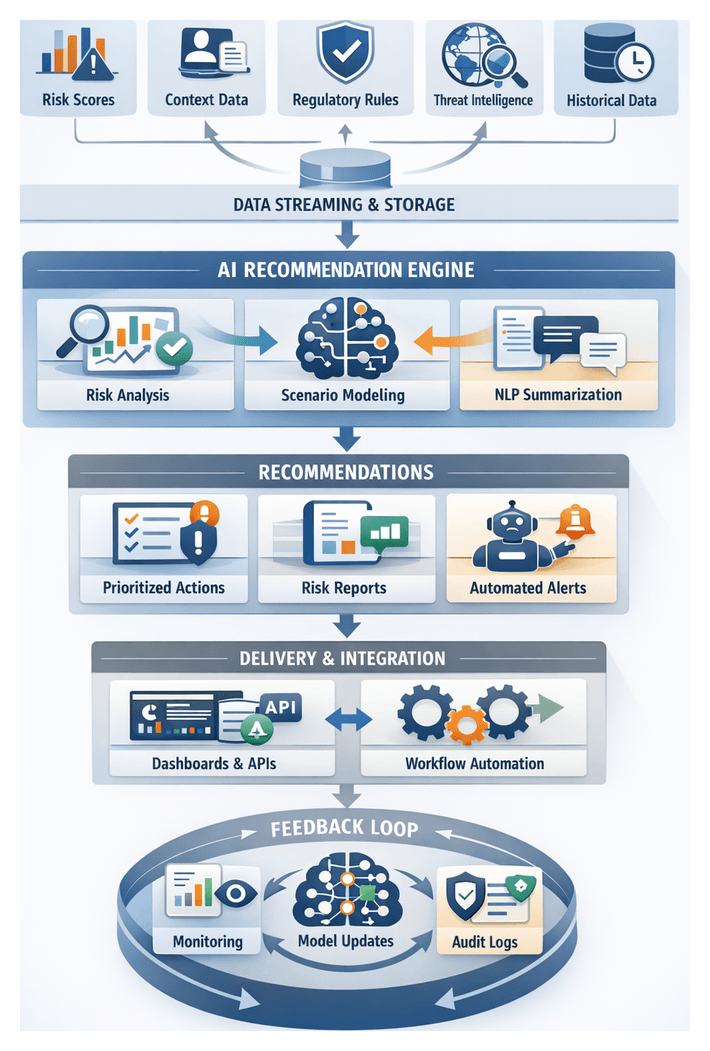
Purpose and Strategic Importance of Recommendation Generation
The decision support and recommendation generation stage translates raw risk assessments into clear, actionable guidance. By aggregating quantitative risk scores, anomaly detections, and contextual metadata, this stage delivers consolidated insights tailored to stakeholder roles. It bridges automated scoring engines and human or system-driven responses, ensuring that recommendations align with organizational policies, compliance requirements, and operational constraints. In highly regulated environments facing complex cyber threats and financial crime, precise, context-aware suggestions reduce analyst fatigue, accelerate decisions, and enhance auditability.
Key outcomes include prioritized actions ranked by severity and business impact, natural language summaries for rapid understanding, and integration-ready outputs for downstream automation or manual review. Consistent recommendation generation fosters accountability by tracing every suggestion back to underlying models, rules, and data sources. This traceability supports compliance reporting, audit processes, and continuous improvement of risk models and operational procedures.
Data Inputs and Context Enrichment
Effective recommendation generation depends on a comprehensive set of inputs and real-time enrichment processes. Core data sources include:
- Risk Scores and Anomaly Indicators: Primary and sub-scores from AI models, anomaly severity levels, confidence metrics, and feature attributions.
- Contextual Metadata: Customer profiles, transaction details (amount, channel, geography), counterparty information, and internal segmentation tags.
- Regulatory and Policy Constraints: Thresholds, rule sets, and compliance mandates retrieved from governance systems.
- External Intelligence Feeds: Fraud blacklists, watchlists, threat intelligence from platforms such as IBM Watson.
- Historical Incident Data: Past cases, remediation actions, and outcomes for scenario analysis.
- Operational Parameters: Service-level agreements, process SLAs, and resource availability.
These inputs are aggregated and normalized via event streaming platforms such as Apache Kafka or Confluent. Streaming pipelines enforce schema consistency, deduplication, and enrichment, delivering standardized payloads to downstream modules. Audit logs record each data retrieval and transformation step, ensuring full transparency and supporting forensic analysis.
Technical and Organizational Prerequisites
Recommendation generation requires:
- Unified Data Repository: A data lake or warehouse (Snowflake, Amazon Redshift) housing validated inputs.
- Model Management: Versioned AI and ML models registered in systems like DataRobot or Microsoft Azure Machine Learning, with metadata on performance and lineage.
- Low-Latency Streaming: Subscriptions to event streams via Kafka or AWS Kinesis for real-time insight delivery.
- APIs and Interfaces: Well-defined RESTful or gRPC endpoints for input ingestion and recommendation output, complete with schema contracts and error handling.
- Access Control: Role-based permissions, OAuth or LDAP integration, and audit logs capturing access events.
- Visualization Platforms: Tools such as Tableau, Microsoft Power BI, Kibana, and Grafana for rendering dashboards.
- Governance Framework: Defined risk appetite, approval workflows, and escalation paths managed by risk councils or governance committees.
- Cross-Functional Collaboration: Ongoing alignment between risk, compliance, IT, and business units to refine recommendation logic and contextual parameters.
- Training and Change Management: Programs to familiarize stakeholders with interpreting automated recommendations and adapting workflows.
- Feedback Mechanisms: Channels for analysts and operations teams to report on recommendation relevance, accuracy, and outcomes, enabling continuous refinement.
Recommendation Engine Workflow
The recommendation engine orchestrates AI models and rule-based classifiers to convert enriched data into prioritized actions. Key stages in the workflow are:
Engine Invocation
- Matching risk profiles to predefined templates using decision trees or business rule management systems.
- Running predictive simulations via DataRobot or Microsoft Azure Machine Learning, evaluating potential actions on risk exposure and efficiency.
- Scoring confidence levels based on historical outcomes and model reliability.
Scenario Analysis and Prioritization
- Defining baseline and stress scenarios informed by market indicators or threat intelligence.
- Simulating interventions—transaction holds, identity verifications, customer notifications—and measuring false positives, customer friction, and resource consumption.
- Aggregating metrics such as fraud prevention rates, compliance adherence, and operational cost.
- Applying multi-criteria decision analysis to rank scenarios, balancing risk mitigation versus business impact through dynamic weighting configured in policy management systems.
Narrative Synthesis
Natural language generation modules, leveraging LLMs like OpenAI GPT or proprietary engines, produce concise summaries that:
- Extract key risk drivers and policy triggers from enriched data.
- Highlight causal linkages, such as correlations between anomaly patterns and known threat campaigns.
- Cite relevant regulatory articles or internal control frameworks.
- Illustrate projected outcomes of accepted versus alternative actions.
Delivery and Integration
- Dashboard Delivery: Interactive panels in Tableau or Power BI that display ranked recommendations, scenario comparisons, and narratives.
- API Delivery: RESTful endpoints exposing structured recommendation objects for orchestration engines or case management systems.
The orchestration layer routes high-confidence, low-impact recommendations for automated execution, while routing complex or high-impact items to analysts. Message queues guarantee reliable delivery and support retry mechanisms.
Feedback and Continuous Improvement
- Recording analyst decisions and rationales to inform model retraining.
- Logging automated execution outcomes with timestamps and system identifiers.
- Tracking metrics—acceptance rates, time-to-decision, risk reduction—and feeding insights back into policy and model updates.
- Maintaining an immutable audit trail of all inputs, processes, and outputs to support compliance and regulatory review.
Roles of AI Agents and Visualization Systems
AI Agent Responsibilities
AI agents act as intelligent intermediaries, performing:
- Data retrieval and contextual enrichment from data lakes, feature stores, and event streams.
- Pattern detection and anomaly explanation using supervised and unsupervised models.
- Natural language synthesis to convert findings into concise narratives.
- Prioritization and triage using business rules and reinforcement learning policies.
- Interactive query handling via conversational interfaces for ad hoc analysis.
Agent Capabilities
- Multi-model Orchestration: Coordinating outputs from predictive, clustering, and rule-based engines.
- Contextual Awareness: Tailoring explanations based on user profiles and session context.
- Dynamic Learning: Updating guidance through feedback loops from accepted or overridden recommendations.
- Scalable Inference: Delivering real-time responses under high load.
- Explainability Integration: Embedding SHAP or LIME interpretations into narratives.
Visualization System Functions
- Interactive dashboards with drill-down views across dimensions like geography or product line.
- Alert panels surfacing high-priority recommendations linked to remediation workflows.
- Automated report generation for compliance documents and executive summaries.
- Embedded analytics widgets for integration into portals and third-party applications.
Integration relies on data flows and APIs:
- Event Streaming: Publishing real-time risk scores and recommendations to Kafka or Amazon Kinesis for immediate dashboard updates.
- RESTful Calls: Visualization tools querying AI agent endpoints for narratives and drill-down data.
- Data Warehouse Sync: Loading aggregated recommendations into Snowflake or Redshift for historical analysis.
- Metadata Catalog Linking: Tracing recommendations to sources via Apache Atlas or Collibra.
An orchestration layer manages update triggers, scheduled dashboard refreshes, role-based access controls, and collaboration integrations with Slack or Microsoft Teams Explainability dashboards, model registries, and human-in-the-loop feedback ensure interpretability and trust.
Structured Recommendation Outputs and Workflow Integration
Recommendation Artifacts
Outputs are codified as structured artifacts carrying:
- Action Identifiers linking recommendations to risk events.
- Action Types (transaction hold, account verification, escalation to fraud or compliance teams).
- Priority Levels based on severity and confidence scores.
- Recommended Timelines aligned with SLAs.
- Responsible Parties (automated engines or designated analysts).
- Supporting Rationale summarizing risk drivers.
- Data References pointing to transaction IDs, session logs, or threat intelligence records.
Metadata and Traceability
- Model Version identifiers from DataRobot or Azure ML registries.
- Data Timestamps for input freshness.
- Policy References linking to governance rules.
- Confidence Metrics and probability scores.
- Correlation IDs maintaining end-to-end workflow linkage.
Integration with Orchestration Platforms
- API Endpoints: Ingesting artifacts into platforms like Palo Alto Networks Cortex XSOAR or Demisto
- Message Queues: Buffering through Apache Kafka or AWS SQS to decouple decision support and execution.
- Workflow Engines: Managing multi-step flows with Camunda or Temporal
- Event Bus Integration: Publishing to enterprise service buses for CRM, fraud, or compliance systems.
- Security Controls: Enforcing authorization via OAuth or LDAP.
Handoff and Feedback Mechanisms
- Correlation Logs preserving context through execution and resolution.
- Audit Records stored immutably for compliance.
- Status Callbacks updating decision support platforms on execution progress.
- Exception Handling Paths and escalation channels for failures or manual reviews.
- Post-Action Feedback Loops feeding execution outcomes into model evaluation pipelines.
Illustrative Recommendation Examples
- Recommendation ID: R-2026-0457 Action Type: Initiate Enhanced KYC Priority: High Timeline: Within 1 hour Responsible Party: Fraud Team Analyst Rationale: Suspicious login from new device and geolocation anomaly detected. Model confidence: 92%. Dependencies: Customer record version 3.4, KYC policy v2.1
- Recommendation ID: R-2026-0789 Action Type: Place Temporary Transaction Hold Priority: Medium Timeline: Immediate Responsible Party: Automated Response Engine Rationale: Unusual transaction pattern exceeding daily velocity threshold. Model confidence: 85%. Dependencies: Transaction feed timestamp 2026-02-26T09:15Z, policy rule TX-005
- Recommendation ID: R-2026-1023 Action Type: Escalate to Incident Response Priority: Critical Timeline: Immediate Responsible Party: Security Operations Center Rationale: Coordinated lateral movements detected across multiple accounts. Model confidence: 98%. Dependencies: Network log ingestion v1.2, SOC playbook v4.7
By standardizing outputs, enriching them with detailed metadata, and defining clear workflow links, organizations achieve seamless integration of AI-driven insights into operational responses. This cohesive approach ensures timely, transparent, and auditable transitions from risk identification to effective action, reinforcing both security posture and regulatory compliance.
Chapter 8: Automated Execution and Response Orchestration
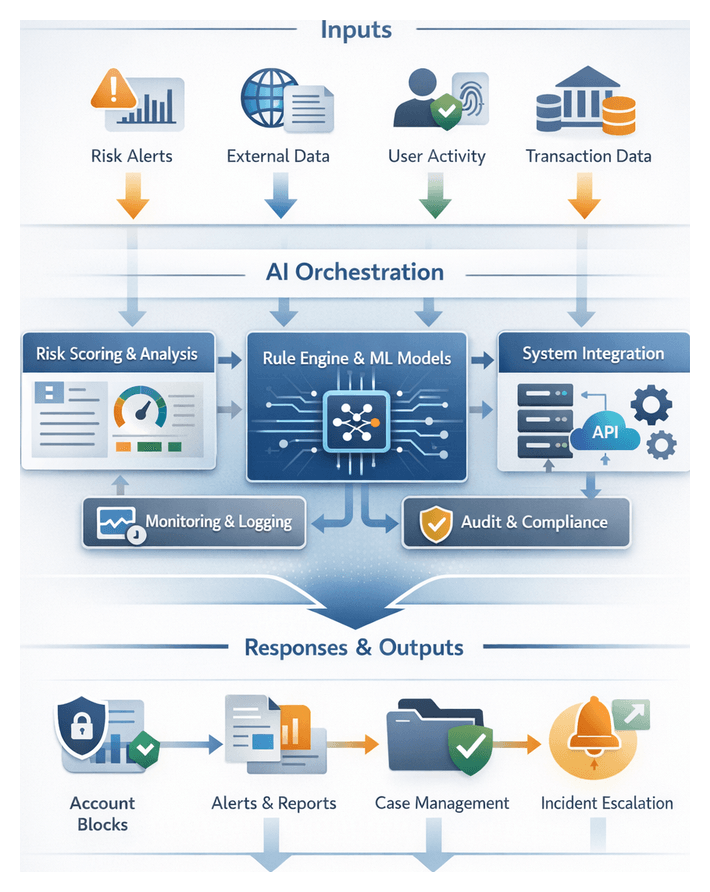
Purpose and Goals of Automated Response Orchestration
Automated response orchestration transforms detected risk signals into rapid, consistent actions that minimize exposure, enforce compliance and preserve reputational integrity. In high-velocity financial environments, embedding decision logic and action sequences within a centralized orchestration layer ensures that elevated fraud scores, transaction anomalies or insider-threat flags trigger predefined interventions without manual delay. Key objectives include:
- Minimizing time from detection to response initiation.
- Maintaining uniform application of mitigation policies across channels.
- Ensuring full auditability of decision logic, triggers and executed actions.
- Reducing manual effort so analysts can focus on complex investigations.
- Facilitating integration with downstream incident management and reporting.
Prerequisites and Essential Inputs
Reliable orchestration depends on well-defined inputs, validated integrations and governance controls. Collaboration among risk, IT, compliance and operations teams is vital to prepare each prerequisite.
Trigger Conditions and Metadata
The orchestration engine consumes structured trigger events from risk scoring outputs, including:
- Risk scores exceeding thresholds (for example, fraud scores above 0.85).
- Categorical flags such as money laundering indicators or velocity anomalies.
- Contextual metadata—account identifiers, transaction details, device fingerprint and geolocation.
- Temporal markers to measure end-to-end latency.
Each event carries metadata tags that map to orchestration workflows, consumed via message queues or API calls.
System Connectivity and Integration
Seamless integration requires:
- API endpoints or message bridges to core banking, identity services, SIEM and ticketing systems.
- Secure credentials and role-based access controls permitting actions like account holds or challenge prompts.
- Network configurations ensuring low-latency communication between orchestration nodes and service endpoints.
- Data schema agreements for consistent field names and formats.
Integration frameworks such as Apache NiFi or specialized solutions support data flow management and AI-driven action coordination.
Governance, Compliance and Data Quality
Automated interventions may carry regulatory implications. Prerequisites include:
- Policy matrices defining which risk categories and severities qualify for auto-triggered actions.
- Approval workflows for compliance officers and business leaders to endorse trigger definitions.
- Documentation of decision logic in policy repositories with version control.
- Data performance metrics: end-to-end latency targets (often under 30 seconds), completeness thresholds and uptime SLAs for middleware and orchestration services.
Monitoring tools such as Prometheus and Grafana uphold these standards, enabling automatic restarts of failed connectors to maintain real-time risk coverage.
External Intelligence and Cross-Channel Inputs
Orchestration can incorporate third-party feeds to enrich risk context:
- Fraud consortium data flagging compromised card numbers.
- Regulatory watchlists and sanctions feeds.
- Threat intelligence reports on malware or emerging attack signatures.
- Customer service inputs triggering identity verification workflows.
Each source is onboarded via API connectors, normalized to internal schemas and mapped to orchestration rules so all triggers are treated uniformly.
Workflow Dependencies and Testing Protocols
Automated response relies on upstream stages:
- Data integration pipelines feeding real-time transaction and customer data.
- Continuous risk identification processes classifying events.
- Validated AI models generating accurate scores and confidence metrics.
- Monitoring infrastructure ensuring uninterrupted data streams.
Architectures often use Kubeflow or DAG-based schedulers to manage these dependencies. Comprehensive testing is essential:
- Unit tests for individual response actions under both nominal and adverse conditions.
- Integration tests confirming trigger propagation from detection to execution.
- End-to-end simulations of real-world attack scenarios.
- Failover and rollback tests verifying retry logic and manual escalation.
- Tabletop exercises with cross-functional teams to rehearse governance and incident response.
Orchestration Workflow and Execution Patterns
The orchestration engine ingests trigger events and translates them into sequenced operations across systems and teams. Core workflow steps include:
- Validating trigger authenticity and context.
- Enriching metadata with customer profiles, transaction history and device attributes.
- Applying business policies via rule engines against a policy repository.
- Constructing dynamic action plans with ordered or parallel tasks.
- Scheduling and dispatching tasks to target systems or human actors.
System Interaction Patterns
Standardized patterns abstract protocol complexity:
- Publish-Subscribe Messaging via Kafka or RabbitMQ.
- Request-Response API calls over REST or gRPC for synchronous operations.
- Event-Driven Callbacks for asynchronous tasks like third-party fraud checks.
- Batch Job Invocations for mass notifications or compliance scans.
Human-in-the-Loop Coordination
Workflows manage handoffs between automation and analysts through:
- Automatic creation of work items in ServiceNow or JIRA when intervention is required.
- Notifications via email, SMS or collaboration platforms (Slack, Teams) with contextual details.
- Approval gates pausing workflows until digital sign-offs are captured.
- Interactive verification dialogues with customers or partners.
Error Handling, Retry and Compensation
Robust error management ensures reliability:
- Idempotent operations prevent duplicate effects.
- Retry policies use exponential backoff and maximum retry counts.
- Compensation transactions reverse partial successes.
- Escalation triggers route persistent failures to manual workflows.
Audit Logging and Transaction Management
Every orchestration step is recorded for compliance:
- Structured event logs capture inputs, outcomes, timestamps and correlation IDs.
- Unique workflow IDs propagate through API calls and messages for traceability.
- Immutable audit trails written to append-only storage or blockchain-backed ledgers.
- Reporting hooks expose log data to BI and compliance tools.
Scalability and Resilience
Architectural patterns sustain performance under variable load:
- Horizontal scalability via clustered orchestration nodes.
- Stateless engines with external state stores (Redis, Cassandra).
- Geo-redundant deployments across data centers or cloud regions.
- Health checks and circuit breakers isolating failing services.
AI Orchestrator Components and Enterprise Integration
The AI orchestrator combines ML models, rule engines and enterprise connectors to deliver adaptive, real-time decision-making. Core components include:
- Workflow Engine: Platforms like Apache Airflow or Palo Alto Cortex XSOAR define DAGs or playbooks for response procedures.
- Decision Service: Hosts AI models and rule engines to evaluate scores, select strategies and manage branching logic.
- Integration Bus: Tools such as MuleSoft or Apache Kafka transport events and payloads between banking systems, case management and messaging platforms.
- State Store: Durable databases or caches (PostgreSQL, Redis or Amazon DynamoDB) track execution context and support rollback.
- Monitoring and Logging: Observability stacks—Elastic Stack or Splunk Phantom—capture metrics, alerts and decision traces.
Integration with Enterprise Systems
- Core Banking (Temenos, Finacle) via REST or gRPC for account holds and authentication.
- CRM (Salesforce, Microsoft Dynamics) for personalized verification and notifications.
- Case Management (ServiceNow, JIRA) to open, update and close tickets.
- SIEM (Splunk, IBM QRadar) for log enrichment and correlated event logging.
- Notification Services (PagerDuty) for on-call alerts and escalations.
AI-Driven Decision Modules
- Rule-Based Trees enforcing compliance when model confidence is low.
- Real-Time Scoring via TensorFlow Serving or Kubeflow inference engines.
- Reinforcement Agents optimizing actions through closed-loop feedback.
- Contextual Enrichment invoking sanctions lists and geolocation services via REST APIs.
Supporting Infrastructure and Third-Party Tools
- Kubernetes for container orchestration, auto-scaling and self-healing.
- Service Mesh (Istio) for mTLS encryption and traffic control.
- Message Brokers (Kafka, RabbitMQ) for reliable event propagation.
- API Gateways (Kong) for authentication, rate limiting and versioning.
- Commercial Platforms: Airflow, AWS Step Functions, Azure Logic Apps, Google Cloud Workflows, UiPath.
Governance and Human-in-the-Loop
Checkpoints route cases to analysts when model confidence falls below thresholds or policy demands sign-off. Approval steps integrate with case management to capture annotations for model retraining and compliance audits.
Monitoring and Observability
- Workflow throughput, latency and end-to-end durations visualized in Grafana or Kibana.
- Model performance metrics tracking false-positive and false-negative rates.
- Integration health indicating API success rates and broker lag.
- Security alerts for unauthorized access or policy violations.
Execution Outputs and Incident Handoffs
Automated responses produce artifacts that drive incident management, compliance reporting and continuous improvement.
Automated Action Records
- Unique action identifiers and timestamps linked to upstream risk events.
- Triggered rule metadata and model confidence levels.
- Execution parameters—account IDs, transaction details, user attributes.
- Outcome status with success, partial success, or failure codes.
- Latency metrics to monitor SLA adherence.
Audit Trails and Logs
- System logs capturing event enqueue, dequeue and dispatch operations.
- Application logs recording decision points and data transformations.
- Security logs for authentication and authorization events.
- Correlation IDs linking detection, orchestration and incident layers.
- Immutable storage references for tamper-evident retention.
Response Summaries and Reporting
- Incident summary reports detailing events, actions and recommendations.
- Key performance indicators for executive dashboards.
- Visualizations of risk trends and action distributions.
- Data exports in JSON or CSV for BI platforms.
Ticketing and Notification Payloads
- Ticket creation payloads with summary, priority, assigned team and correlation ID.
- Notification messages via email, SMS or chat containing context and links.
- Escalation protocols adjusting severity based on elapsed time or outcome.
- Schemas aligned with ITIL and internal SLA specifications.
Connector Requirements
- Secure authentication (OAuth2, JWT, mutual TLS) for all API calls.
- Schema validation enforcing JSON or XML contracts.
- Retry and fallback logic with exponential backoff.
- Throughput and latency SLAs for connector performance.
- Monitoring hooks exposed via Prometheus or CloudWatch.
Incident Management Handoff Processes
- Automated ticket assignment with intelligent routing by type and region.
- Triage notifications to on-call analysts with execution record links.
- Analyst review workflows guiding verification and evidence collection.
- Feedback loops capturing annotations for continuous improvement.
Compliance Reporting and Data Retention
- Scheduled export of execution records and logs to encrypted long-term storage.
- Automated compliance report generation per regulatory formats.
- Role-based access controls enforcing separation of duties.
- Retention governance with legal hold flags and configurable periods.
Best Practices for Output Management
- Propagate correlation IDs through all systems to maintain traceability.
- Continuously validate output schemas and run contract tests for connectors.
- Implement alert suppression and deduplication to avoid noise.
- Review retention policies regularly to align with regulatory changes.
- Conduct periodic drills and tabletop exercises to verify handoff readiness.
Chapter 9: Compliance Tracking and Reporting
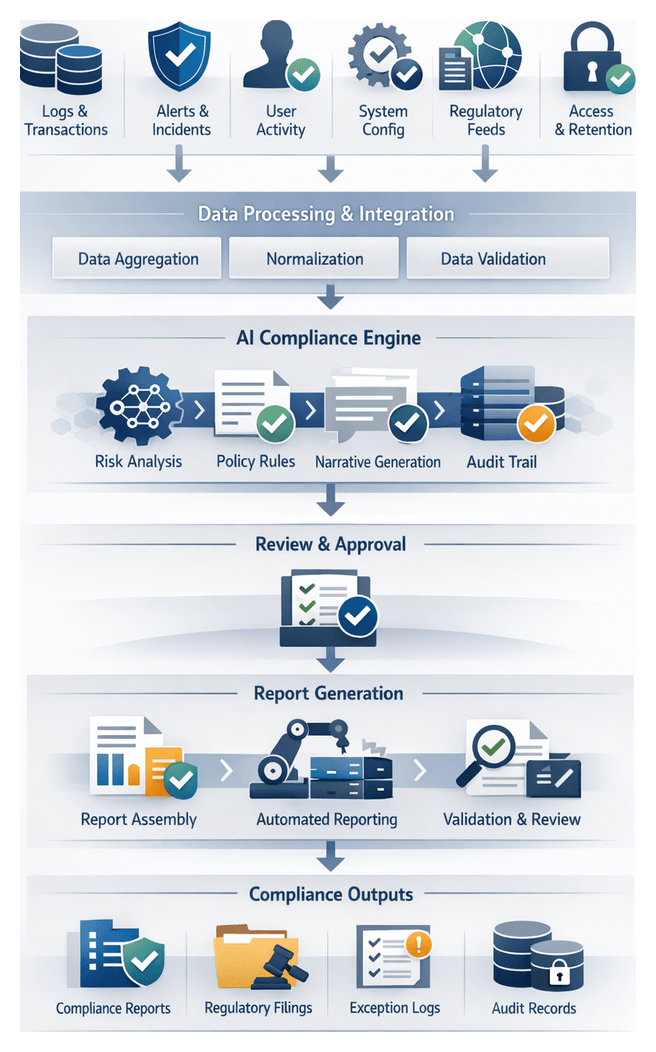
Compliance Objectives and Data Foundations
In a financial services context, compliance tracking and reporting serve as the bedrock for demonstrating adherence to regulatory mandates and internal policies. By defining clear objectives and gathering precise data inputs, institutions ensure audit readiness, transparency, and timely submission of compliance documentation. Integrating AI-driven capabilities enhances accuracy, reduces manual effort, and minimizes non-compliance risk.
- Regulatory Alignment: Map recorded events and actions to frameworks such as anti-money laundering, know-your-customer, data privacy, Basel III, Dodd-Frank, MiFID II and local supervisory guidelines.
- Audit Readiness: Maintain tamper-evident logs and reports satisfying internal audit requirements and external examinations.
- Transparency and Traceability: Provide end-to-end visibility into risk detection, decision-making and remediation, enabling stakeholders to reconstruct workflows.
- Timely Reporting: Generate and distribute compliance reports on mandated schedules, supporting real-time or periodic submissions.
- Policy Enforcement: Document adherence to internal control frameworks, including deviations, escalations and corrective actions.
- Data Retention and Security: Implement retention policies, secure access controls and encryption to safeguard data integrity.
To support these objectives, institutions must collect a diverse set of inputs from upstream systems:
- Event logs from core banking applications, middleware and network devices, timestamped for chronological accuracy.
- Transaction records detailing amount, participants, channels, geolocation and currency.
- Alert and incident metadata from anomaly detection, fraud engines and SIEM platforms.
- Remediation actions: holds, verifications and escalations recorded by incident response tools.
- User activity and access logs from identity and access management systems.
- Configuration versions of detection systems, risk policies and threshold parameters.
- External regulatory feeds containing updates to rulebooks and obligation registers.
- Audit trail metadata capturing report generation, distribution and approval events.
Effective data collection requires robust prerequisites:
- Unified Data Model: Harmonize schemas for events, timestamps and identifiers.
- Time Synchronization: Normalize clocks across sources to ensure accurate sequencing.
- Data Quality Standards: Enforce validation rules for completeness and format correctness.
- Secure Transport and Storage: Use encrypted channels and hardened repositories to prevent tampering.
- Metadata and Lineage Tracking: Capture source identifiers, ingestion timestamps and transformation history.
- Regulatory Rule Engine Configuration: Map raw events to compliance controls in machine-readable rule sets.
- Retention and Archival Policies: Define data lifecycles, archival tiers and secure deletion procedures.
- Access Controls: Apply role-based permissions to restrict data viewing, modification and export.
Stage activation hinges on completion of upstream detection and scoring, availability of enrichment metadata (customer profiles, sanction lists, third-party risk indicators), integration with document generation and reporting platforms, alignment with applicable compliance frameworks, defined escalation paths for incident review, and configured stakeholder access and notification settings.
Reporting Workflow and AI-Driven Automation
The reporting workflow transforms raw event and action records into structured, audit-ready documents. Through standardized templates, automated data extraction, AI-driven narrative synthesis and coordinated review processes, institutions achieve consistency, efficiency and transparency in compliance reporting.
Data Aggregation, Normalization and Template Assembly
Multiple source systems feed a central reporting pipeline. Inputs include event logs, alert records, SIEM incident details, case notes and AI scoring metadata. A data orchestration engine normalizes field names, time-zones and code sets, producing a unified dataset.
Report templates—stored in a registry service—define structure, sections and formatting rules for daily summaries, weekly exception reports, regulatory filings and ad hoc analyses. Template metadata includes required fields, layout definitions, approval routing and retention policies. Trigger events, such as high-severity incident closure, initiate document generation.
Automated Data Population and Narrative Synthesis
The document-generation engine injects normalized data into template placeholders via field mapping, conditional section inclusion and chart rendering. At each step, logs record success or error codes, enabling retries and alerting.
AI-driven natural language generation modules leverage platforms such as OpenAI’s GPT-based models and IBM Watson Natural Language Understanding to produce executive summaries, incident narratives and recommendations. Generated paragraphs carry confidence scores, guiding human reviewers to sections needing editorial attention.
Review, Version Control and Distribution
A workflow orchestration layer routes drafts to stakeholders—risk managers, compliance officers, IT security and legal counsel—via email or messaging integrations. Review tasks allow annotations, change requests and approvals. All edits and comments are captured in an immutable version control repository, supporting branching for parallel streams and roll-back to prior versions.
Once final sign-offs are obtained, the workflow engine triggers distribution actions: secure API submissions to regulatory portals, internal email and content management systems, enterprise dashboards and archival repositories. Distribution metadata—recipient lists, transmission timestamps and confirmations—are recorded for audit evidence.
Integrated System Ecosystem
- Data orchestration platforms schedule and manage extraction from source systems.
- Template registry services control document schemas and routing.
- Document-generation engines merge data and narrative content.
- NLG modules synthesize narrative summaries and recommendations.
- Workflow orchestration layers manage review, approvals and escalations.
- Version control repositories track revisions with immutable audit trails.
- Distribution interfaces publish finalized documents to external and internal channels.
AI Reporting Engines and System Responsibilities
AI reporting engines serve as the analytical and orchestration backbone, transforming raw risk data into audit-ready compliance artifacts. These engines integrate advanced analytics, natural language generation, policy validation and provenance tracking to automate narrative synthesis, ensure regulatory alignment and maintain full traceability.
- Narrative Synthesis: Natural language generation modules, backed by OpenAI’s GPT-based models and IBM Watson Natural Language Understanding, craft coherent summaries, detailed incident descriptions and control improvement recommendations.
- Policy Compliance Validation: Using Microsoft Azure Compliance Manager, policy libraries are encoded as machine-readable rule sets that evaluate events, flag deviations and annotate non-compliant items.
- Automated Document Assembly: Templating frameworks populate scope, methodology, findings and recommendations. Connectors to Microsoft Word and Adobe PDF libraries produce polished deliverables with version metadata.
- Data Lineage and Audit Trails: Integration with provenance systems logs each transformation, enrichment and validation step, recording actor identifiers, timestamps and affected data elements.
- Data Integration: Platforms such as Apache NiFi and AWS Audit Manager extract inputs from data lakes and SIEM solutions, while metadata catalogs maintain schema definitions and lineage pointers.
- Scalability and Orchestration: Workflow engines like Apache Airflow and Azure Data Factory schedule pipelines, orchestrate containerized AI workloads for narrative generation and policy validation, and optimize resource utilization.
- Security and Access Control: Role-based permissions, encryption at rest and in transit, and secure key management protect sensitive data. Audit logs capture every access and modification event.
- Error Handling: Exception modules detect incomplete data or schema mismatches, triggering automated retries, alerts and notification to stakeholders for manual intervention.
- Continuous Policy and Model Updates: Version control systems track changes to rule sets, AI models and templates. Scheduled reviews prompt compliance teams to approve updates, which propagate automatically to the reporting engine.
Output Artifacts, Integration and Audit Readiness
The final stage packages compliance artifacts—machine-readable extracts, narrative summaries, audit logs and structured templates—governed by metadata and dependencies to support internal oversight and external review.
Key Artifacts and Metadata
- Executive Compliance Summary: Board-level overview of risk posture, resolution status and compliance score trends.
- Detailed Event and Action Log: Chronological record of risk signals, anomaly triggers, scores, recommended actions and automated responses.
- Regulatory Submission Package: Preformatted templates and data extracts mapped to SOX, Basel III, MiFID II or GDPR requirements.
- Audit Trail Metadata Export: Time-stamped records of approvals, model version identifiers from IBM Watson OpenScale, data source fingerprints and cryptographic checksums.
- Exception and Issue Register: Unresolved anomalies or policy deviations requiring manual remediation.
Each artifact carries core metadata—UTC and local timestamps, source system identifiers, connector names, ingestion pipeline version, user identity and change history—ensuring traceability and non-repudiation.
System Dependencies and Handoffs
Report accuracy relies on upstream data components: risk signal repositories, anomaly scoring engines, automated risk assessment modules and decision support logs from the orchestration layer. Prior to generation, dependencies undergo checksum comparisons, schema conformance and timestamp reconciliation.
Completed reports are handed off via:
- Enterprise GRC platforms such as ServiceNow GRC, MetricStream or RSA Archer.
- Executive distribution with secure email and PKI-enforced digital signatures.
- Automated submissions to regulatory portals via secure APIs or file uploads.
- Read-only auditor access through locked-down SharePoint or document management systems.
- Visualization in Microsoft Power BI dashboards with drill-down capabilities.
Traceability, Version Control and Archival
All templates, data extracts and model references carry semantic version tags managed in a centralized registry using Git. A lineage graph links report sections back to raw transaction logs, enabling auditors to traverse from high-level findings to underlying data.
Reports and logs are archived in immutable object storage with FIPS-compliant encryption. Lifecycle policies automate tiered storage transitions, while retrieval workflows offer full-text search, time-range filters and secure download with one-time access tokens.
Audit Dependencies and Continuous Improvement
Audit readiness aligns each artifact to control requirements—SOX Section 404, GDPR breach notification timelines, Basel III disclosures and MiFID II transaction formats. A centralized control matrix enables rapid cross-reference during inspections. Digital signatures and hashed records on external ledgers provide tamper-evident authenticity. Automated health checks verify file integrity before distribution.
Stakeholder feedback—from internal audits and regulatory responses—is captured in issue tickets and routed into continuous improvement workflows, informing model retraining, process refinement and policy updates to drive higher compliance maturity.
Chapter 10: Continuous Improvement and Feedback Loop
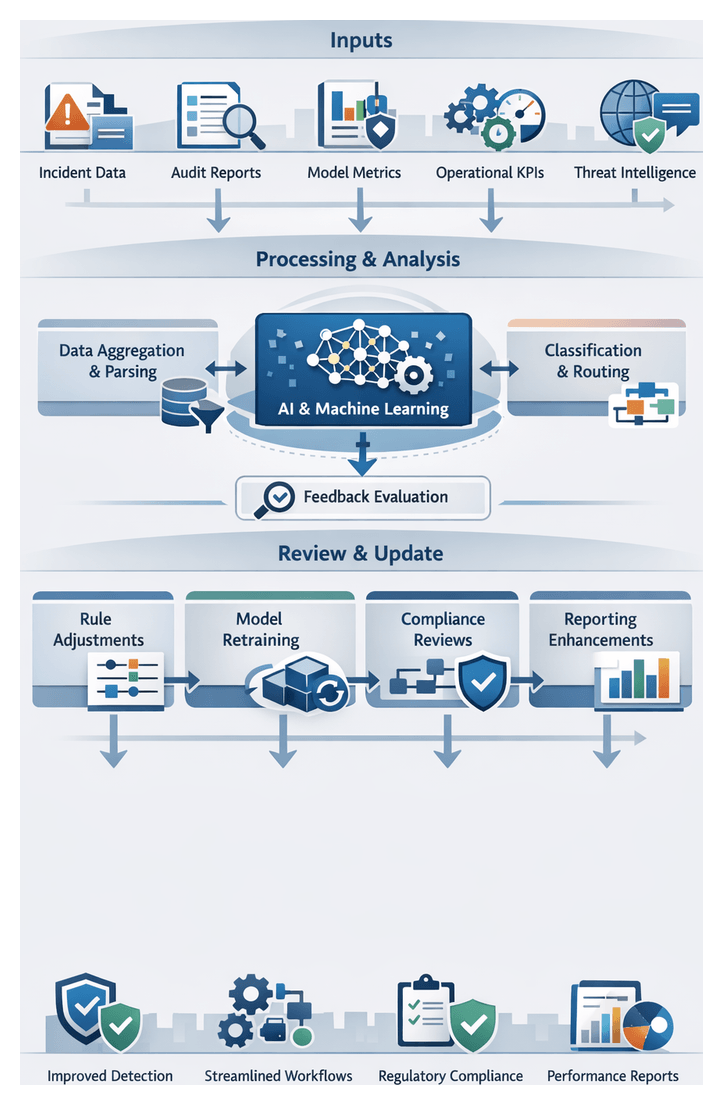
Feedback Data Sources and Improvement Objectives
The continuous improvement loop is the engine that drives adaptive refinement of AI models, detection rules, and operational workflows within a financial institution’s risk mitigation framework. By systematically capturing and analyzing feedback from diverse sources, organizations can address model drift, process inefficiencies, and evolving threat vectors to sustain detection fidelity, streamline analyst workflows, and reinforce compliance posture.
Key feedback sources include:
- Incident Resolution Outcomes: Records of alerts triggered, response actions, and case dispositions reveal false positives, escalation timelines, and remediation effectiveness.
- Compliance and Audit Reports: Findings from internal audits, regulatory examinations, and third-party assessments highlight policy deviations, documentation gaps, and required control enhancements.
- Model Performance Metrics: Indicators such as precision, recall, false positive rate, and drift indices tracked via platforms like MLflow or Amazon SageMaker.
- Operational Efficiency Indicators: Metrics on alert processing time, backlog, analyst workload distribution, and resource utilization expose workflow bottlenecks.
- External Threat Intelligence: Feeds from commercial services and open-source repositories, industry consortium reports, and vulnerability advisories ensure alignment with emerging attack patterns.
- User and Analyst Feedback: Qualitative insights from risk analysts, incident responders, and business stakeholders on rule sensitivity, usability, and reporting clarity.
Improvement goals should be defined with measurable targets, for example:
- Reduce false positives by 30 percent within six months, measured by the ratio of valid alerts to total reviewed.
- Improve detection latency by 25 percent, from event ingestion to actionable alert generation.
- Maintain over 90 percent detection accuracy through quarterly retraining cycles that incorporate newly labeled data.
- Streamline analyst workflows to cut manual review hours by 20 percent via automation and recommendation engines.
- Ensure 100 percent coverage of regulatory requirements in generated audit documents through automated policy checks.
Prerequisites for effective feedback integration include:
- Comprehensive logging and tracking across ingestion, inference, alerting, and response systems.
- Clearly defined KPIs for performance, efficiency, and compliance coverage.
- A data governance framework enforcing quality standards, access controls, and lineage tracking.
- Version control and experiment tracking via tools like MLflow.
- Cross-functional review channels, including regular feedback forums for data scientists, analysts, compliance officers, and IT operations.
- Change management workflows that require impact assessments, testing plans, and rollback procedures.
Contextual factors—regulatory changes, market volatility, technology upgrades, and threat landscape evolution—dictate the urgency and focus of feedback activities. Embedding these elements into the loop ensures that detection models and processes remain aligned with dynamic business and compliance demands.
Orchestrating Feedback Processing and Workflow Updates
In the feedback processing stage, data from incident systems, audit reports, performance dashboards, and analyst inputs are ingested, parsed, classified, and routed to drive actionable updates. Automated connectors retrieve information from incident management platforms such as ServiceNow and JIRA, GRC tools, and model monitoring dashboards in MLflow, Amazon SageMaker, or Kubeflow. Free-form analyst feedback enters through ticketing systems and collaboration portals.
Once centralized, entries undergo automated parsing and classification using natural language processing modules orchestrated in pipelines built with MLflow. Classification outputs identify feedback category (false positive, rule gap, drift, regulatory change), assess preliminary severity, and map items to relevant workflow stages (rule updates, model retraining, policy review).
Classified feedback is routed via a workflow engine—such as Kubeflow Pipelines or an enterprise BPM platform—to stakeholder queues:
- Rule Maintenance Team for detection logic and threshold adjustments.
- Model Development Team when retraining or feature review is required.
- Compliance Committee for regulatory or audit-driven process changes.
- Business Analysts for reporting enhancements and user experience improvements.
Each queue enforces deadlines, tracks progress, and logs handoffs. Root cause analysis is conducted collaboratively, with AI-enhanced assistants correlating historical incidents, visualizing feature distributions, and suggesting rule or policy modifications. The outcome is a change request package containing impacted rule identifiers, model artifacts, cost–benefit analyses, and regression test plans.
Change requests follow a structured approval workflow:
- Submission of the consolidated change package.
- Technical review by architecture and security teams.
- Compliance review for regulatory alignment.
- Testing and validation planning by quality assurance.
- Final approval, scheduling, and deployment window assignment.
Approved updates are deployed through CI/CD pipelines that synchronize rule repositories, trigger retraining jobs in Amazon SageMaker or MLflow, update data transformation scripts, and publish revised documentation. Continuous integration tools such as Jenkins or GitLab CI/CD execute smoke tests and end-to-end scenarios, with rollback mechanisms to revert unintended changes.
Post-deployment, real-time monitoring verifies the impact of updates by comparing alert volumes, false positive rates, and model performance benchmarks against predefined service-level objectives. User surveys capture qualitative analyst feedback, feeding any residual issues back into the repository and closing the loop. Governance controls maintain an auditable trail of every feedback item, change request, approval, and deployment action, satisfying internal reviews and regulatory examinations.
AI Model Retraining, Version Control, and Governance
Model retraining and version control underpin the continuous improvement cycle, ensuring AI models remain accurate and compliant as transaction patterns, fraud tactics, and regulatory rules evolve. Drift detection mechanisms monitor feature distributions using population stability index (PSI) metrics and track KPI deviations—precision, recall, false positive rates—through performance observability engines. Alerting integrations notify data scientists and MLOps engineers when thresholds are breached.
Upon drift detection, automated retraining pipelines orchestrate data versioning, feature retrieval from the feature store, and compute scheduling via Apache Airflow or Jenkins. Workflow execution engines like Kubeflow Pipelines manage retries, dependencies, and validation gates to prevent propagation of defective code or data.
Experiment tracking platforms such as MLflow or Weights & Biases log metadata for each run—hyperparameters, data versions, code commits, and evaluation metrics—enabling reproducibility and informed model selection. Metadata catalogs maintain lineage between datasets, code, and model artifacts, while automated dashboards surface performance comparisons across training cycles.
Validated models are registered in a model registry—for example, MLflow or Kubeflow—with immutable artifact storage, semantic version tagging, access controls, and integration with data versioning tools like DVC. This registry enforces separation of duties by restricting who can promote models from staging to production.
Before promotion, retrained models undergo automated tests within CI/CD pipelines:
- Performance validation using hold-out sets and simulated transaction streams.
- Bias and fairness checks across customer segments.
- Stress tests under peak-volume scenarios.
- Security scans for vulnerabilities in model artifacts and endpoints.
Failing any test halts the deployment. Models that pass are tagged for shadow or canary deployment to observe behavior in controlled slices of production traffic.
Collaboration across data science, IT operations, compliance, and business teams is supported through workflow notifications, review boards in platforms such as DataRobot, policy enforcement engines, and audit trail generation. These systems document every change, approval decision, and pipeline event, ensuring transparency and accountability.
In production, inference telemetry collectors log input features, risk scores, and outcomes. Drift and performance dashboards surface emerging deviations, triggering alerts to incident management tools and feeding back misclassifications to the retraining pipeline. This continuous monitoring phase perpetuates the improvement cycle, maintaining resilient risk detection capabilities.
Optimized Outputs, Iteration Handoffs, and Traceability
The culmination of the continuous improvement stage is a set of refined artifacts and updated workflows ready for handoff to operational teams and orchestration engines. Key output artifacts include:
- Versioned Model Packages: Serialized model binaries with retraining logs, metadata on training data, feature importances, and performance benchmarks.
- Retraining and Experiment Reports: Documentation of each cycle, comparative analyses of precision, recall, false positive rates, and inference latency.
- Updated Feature Definitions and Pipelines: Revised enrichment rules and preprocessing configurations maintained in the feature store.
- Process and Governance Documentation: Enhanced SOPs, audit checklists, and compliance mappings reflecting new controls and lessons learned.
- Performance Dashboards: Snapshot exports illustrating post-optimization trends and anomaly rates.
- Deployment Manifests and Pipeline Configurations: Updated CI/CD scripts, container images, and workflow definitions for staging and production promotion.
These outputs depend on integrated systems: model registries (MLflow, Kubeflow), feature stores, CI/CD engines (Jenkins, GitLab CI/CD), real-time monitoring (Elasticsearch, Splunk), audit platforms, and collaboration repositories. Robust handoff mechanisms ensure smooth transition:
- Automated Promotion to Staging: CI/CD workflows deploy retrained models and updated pipelines to staging for integration checks and smoke tests.
- Change Management Tickets: ITSM integration generates tickets summarizing updates, rollback plans, and validation criteria for stakeholder review.
- Dashboard Refresh and Reports: Updated dashboards and scheduled reports notify governance teams and executives of improvements in detection accuracy and compliance alignment.
- Configuration Synchronization: Infrastructure-as-Code manifests and container orchestration definitions are versioned, with hooks to flag manual changes.
- Data Pipeline Updates: ETL workflows and connectors reference updated schemas and feature sets, with orchestration engines managing zero-downtime transitions.
- Governance Approval Gates: Role-based controls ensure formal sign-off from risk and compliance officers before live deployment.
Traceability is maintained through metadata on author and approver identities, timestamps, linked incident or audit findings, change descriptions, rollback procedures, and performance baselines. This comprehensive record supports forensic analysis, compliance audits, and internal review processes.
Finally, optimized outputs feed insights back into upstream stages—adjusting data ingestion connectors, recalibrating detection thresholds, refining escalation policies, updating score aggregation weights, and evolving recommendation templates. Clear roles and responsibilities—from data engineers and ML engineers to DevOps, risk officers, and incident response leads—ensure accountability at each handoff. Key success metrics, such as time to deploy retrained models, reduction in false positives, compliance audit cycle times, mean time to resolution, and stakeholder satisfaction scores, validate the effectiveness of iteration handoffs and sustain an agile, resilient risk management posture.
Conclusion
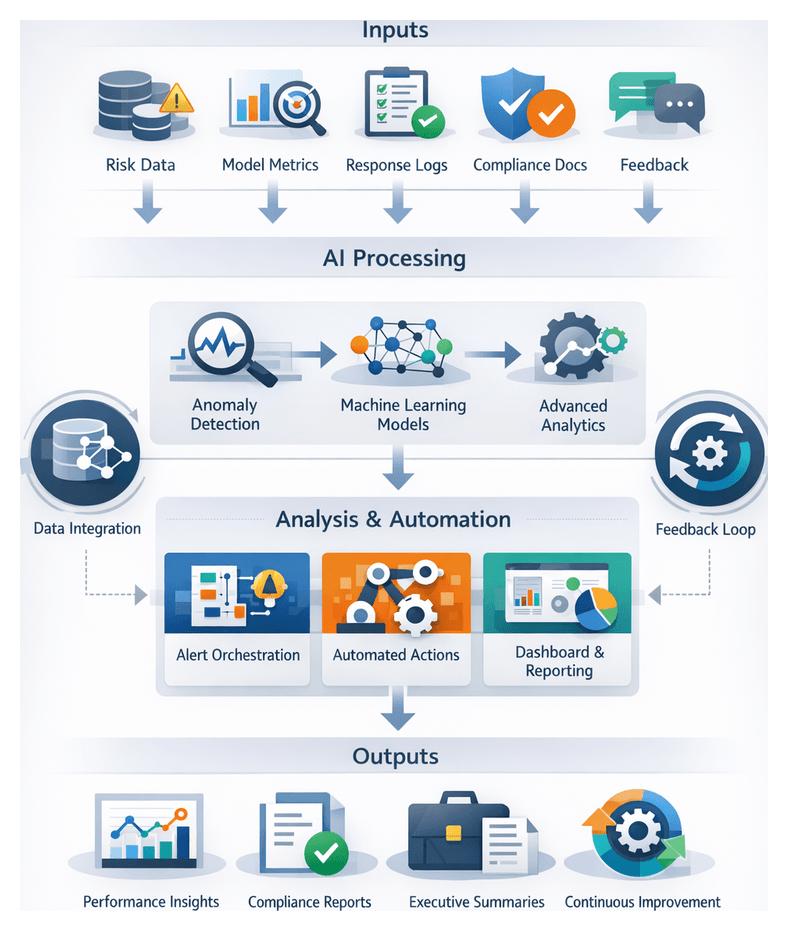
Strategic Reflection and Consolidation
The concluding stage of an AI-driven risk mitigation workflow transforms detailed outputs into an integrated narrative that validates performance, ensures regulatory compliance, and informs executive decision making. By aggregating risk data artifacts, model metrics, operational logs, compliance records, and stakeholder feedback, institutions demonstrate measurable business value, maintain transparent governance, and preserve institutional knowledge for continuous improvement.
This phase aligns technological outputs with organizational objectives through four key objectives:
- Validate end-to-end effectiveness against metrics such as detection latency, false positive rates, and response times
- Map actions and outcomes to regulatory frameworks and internal policies
- Communicate insights and strategic recommendations via executive summaries and dashboards
- Capture lessons learned to iterate on AI models and operational processes
Essential Inputs and Preconditions
Successful synthesis depends on comprehensive, high-integrity inputs from prior workflow stages and established readiness conditions. Core input categories include:
Consolidated Risk Data Artifacts
- Normalized extracts of transaction logs, customer profiles, and threat intelligence
- Tagged signal records with timestamps, severity levels, and classification labels
- Anomaly detection outputs with scoring vectors and deviation metrics
Model Performance Metrics
- Accuracy, precision, recall, and AUC statistics from training and validation reports
- Drift detection logs tracking data distribution shifts
Operational and Response Logs
- Alert histories with resolution states and timestamps
- Automated response records detailing action types and outcomes
Compliance and Audit Trail Documents
- Populated regulatory reporting templates
- Policy mapping matrices linking incidents to standards
Feedback and Performance Reviews
- Post-incident summaries with root cause analysis
- Stakeholder input from risk committees and business units
Resource and Capacity Information
- Compute utilization metrics for streaming inference and training jobs
- Staffing levels and tool availability
Key preconditions include robust data governance with documented lineage, stakeholder alignment on risk appetite and reporting formats, operational readiness of AI pipelines, up-to-date regulatory references, and established cross-functional collaboration mechanisms.
Measuring Operational Gains
Institutions quantify AI-driven improvements through a dedicated metrics pipeline that consolidates logs and event data into a time-series store such as Datadog or Databricks Delta Lake. Metrics are tagged by workflow stage and business unit to enable granular analysis.
Key Performance Indicators
- Mean Time to Detect (MTTD): Interval from risk signal ingestion to alert generation, often reduced by 50–70 percent
- Mean Time to Respond (MTTR): Time from alert to mitigation action, halved through automation with Splunk Phantom
- False Positive Rate: Declined by up to 60 percent via AI-driven anomaly detection
- Analyst Throughput: Increased by 40–80 percent through AI-generated summaries
- Compliance Report Cycle Time: Shortened from days to hours with automated documentation
- Cost Savings: Achieving 20–30 percent reductions in operational risk budgets
Data Flow and System Interactions
Streaming connectors extract event data from AI inference platforms like TensorFlow Serving, orchestration engines such as Apache Airflow, and alerting systems, feeding a centralized database. A typical flow:
- Anomaly detection event is sent via Apache Kafka
- Analytics engine applies models and forwards high-risk alerts to the orchestration layer
- Automated actions—transaction holds, identity verifications—are executed
- Execution logs are captured and forwarded to the metrics pipeline
- Analyst interventions are recorded in case management interfaces
Real-time dashboards built on Apache Flink, Spark Structured Streaming, Prometheus, InfluxDB, Grafana, and Kibana provide visibility into operational performance.
Stakeholder Coordination and Feedback
- Daily stand-up reports automate MTTD, MTTR, and false positive summaries
- Weekly performance reviews highlight trends and model retraining triggers
- Monthly executive briefings showcase cost savings and compliance improvements
- Ad hoc debriefs analyze metric trails after major incidents
Operational metrics directly feed the continuous improvement cycle, triggering root cause analyses, feature engineering for anomaly detection, compliance optimizations, and infrastructure scaling.
Strategic and Business Impact
AI-powered risk mitigation elevates strategic decision making by delivering real-time risk dashboards and scenario simulations that integrate transactional, behavioral, and threat intelligence data. Predictive models forecast adverse events under varying market conditions, while natural language generation tools generate concise executive narratives.
Competitive differentiation arises from faster threat response, frictionless customer experiences via adaptive authentication, and risk-aware innovation in digital products and pricing. Institutions tailor offerings with real-time credit scoring and embed risk controls into new services, capturing market share without disproportionate exposure.
Regulatory alignment is achieved through automated policy monitoring, NLP-driven regulatory scanning, and AI-powered reporting engines that provide audit-ready documentation and evidence trails. Multi-jurisdictional compliance is managed with localized rule sets and automated data residency controls.
Operational efficiency gains from robotic process automation, optimized anomaly thresholds, and elastic cloud-native architectures reduce overhead and reallocate specialized talent to high-value tasks. Automated orchestration platforms such as Apache Airflow and Camunda ensure seamless incident response and compliance reporting without proportional headcount increases.
By fostering a culture of continuous innovation—supported by automated model retraining using CI/CD pipelines, experiment tracking with MLflow and Weights & Biases, and crisis simulation exercises—institutions build resilience and maintain agility as threat landscapes evolve.
Consolidated Outputs and Continuous Improvement
The final synthesis delivers a comprehensive repository of artifacts that underpin future risk mitigation cycles. Core outputs include:
- Normalized datasets and enriched metadata catalogs from the data lake with dependencies on Apache Kafka, AWS Kinesis, Snowflake, Databricks, Apache Airflow, and AWS Glue
- Tagged signal streams in JSON or Parquet format served by TensorFlow Serving or Kubeflow
- Certified model artifacts and evaluation reports with registration in MLflow or Weights & Biases registries and deployment via AWS SageMaker
- Interactive monitoring dashboards with real-time metrics visualizations in Grafana, Kibana, Prometheus, and InfluxDB
- Structured alert objects escalated through Splunk, and incident routing via PagerDuty or ServiceNow
- Prioritized recommendations and narrative summaries generated with OpenAI and orchestrated by Temporal
- Detailed execution logs and incident handoffs from Apache Airflow and Camunda
- Audit-ready compliance reports produced by Splunk Phantom and custom BI tools
- Optimized process definitions, retrained model artifacts, and gap analysis reports ready for CI/CD pipelines and version control
Automated notifications inform data scientists, analysts, and operations teams of new artifacts, closing the feedback loop and enabling continuous enhancement of AI models, orchestration logic, and risk management processes.
Appendix
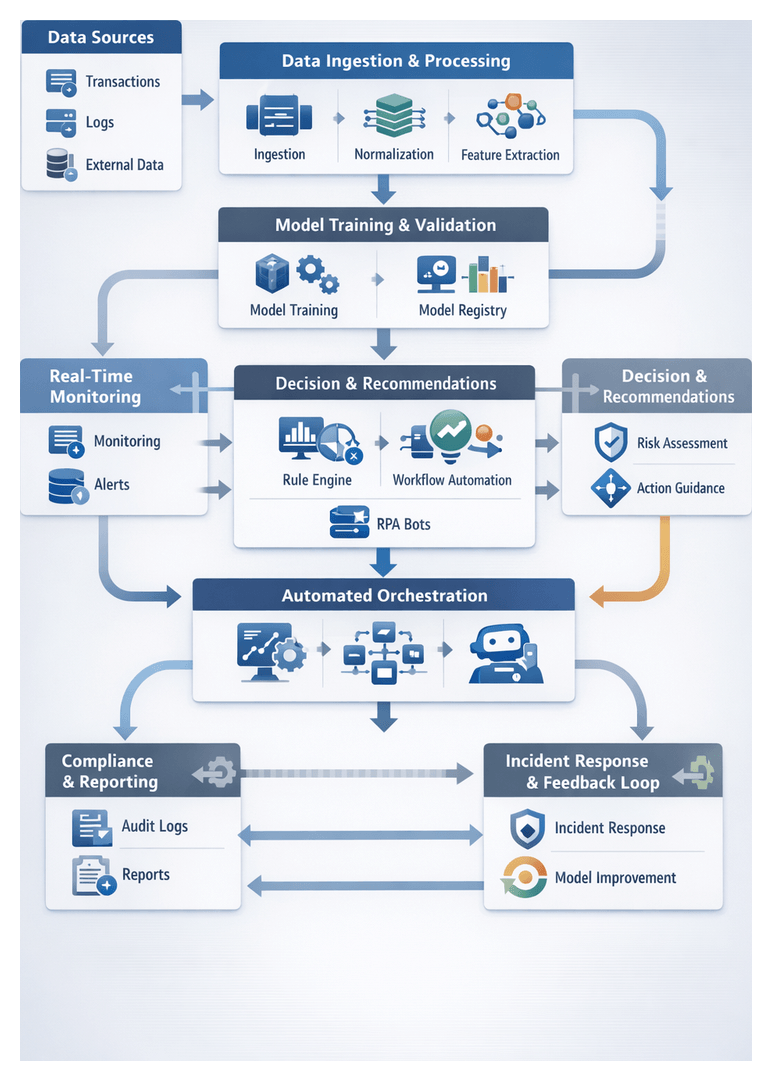
Workflow Terminology and Risk Taxonomy
A unified glossary of workflow and risk management concepts ensures clear communication, seamless integration and regulatory compliance across data engineering, risk, compliance and IT operations.
Workflow Concepts
- Stage: A distinct phase such as data ingestion, model inference or response orchestration, each with defined inputs, outputs and responsible teams.
- Task: An atomic unit of work within a stage—data validation, feature extraction or API call—that executes sequentially or in parallel.
- Pipeline: An automated sequence of tasks and stages that transports and transforms data under an orchestration engine.
- Trigger: An event or condition—new transaction data, job completion or policy violation—that initiates a task or pipeline.
- DAG (Directed Acyclic Graph): A dependency map ensuring tasks run only after upstream prerequisites complete.
- Orchestrator: The scheduler and monitor—such as Apache Airflow or Prefect—that enforces dependencies, retries failures and reports health.
- Connector: Secure adapters for REST APIs, message queues or change data capture (e.g., Debezium).
- Data Lake: A scalable, schema-on-read repository for raw, normalized and enriched data.
- Normalization and Enrichment: Harmonizing formats and appending context—geolocation, watchlist scores—to raw data.
- Feature Store: A managed repository that version-controls and serves features for offline training and online inference.
- Model Registry: A catalog tracking model versions, metadata, performance metrics and approval status.
- Inference: Applying a trained model to new data to generate predictions—risk scores or anomaly probabilities.
- Checkpointing: Persisting intermediate workflow state to enable restart after failures without data loss.
- Schema Registry: A service enforcing compatibility of data schemas across producers and consumers.
Risk Taxonomy Concepts
- Risk Signal: An indicator—unusual transaction pattern or flagged IP—identified by AI or rules as potentially risky.
- Anomaly: A deviation from an established baseline detected via unsupervised learning or statistical control.
- Risk Score and Risk Tier: Quantitative metrics and categorical levels (low, medium, high, critical) used to prioritize actions.
- Confidence Score and Threshold: Model-derived certainty metrics and boundaries triggering alerts or automated responses.
- False Positive and False Negative: Incorrect high-risk classifications and undetected genuine risks, respectively.
- Alert and Incident: Notifications of threshold breaches and consolidated cases managed through case systems.
- Playbook and Escalation Protocol: Documented investigative steps and rules for elevating incidents by severity or elapsed time.
- Compliance Event and Audit Trail: Recorded actions with regulatory implications and comprehensive immutable logs for review.
AI Capabilities by Workflow Stage
Mapping AI-driven tools and techniques to each stage of the risk mitigation workflow delivers proactive detection, rapid response and robust compliance.
Data Ingestion and Integration
- AI-Driven Connectors: NLP and pattern recognition in Apache NiFi extensions automate schema inference, mapping and adaptation to evolving formats.
- Automated Enrichment: ML services integrate third-party identity verification and geolocation, appending risk scores from external watchlists.
- Data Quality Assurance: Unsupervised models profile streams to flag missing fields, outliers or schema deviations before data enters the lake.
- Metadata Inference: AI agents extract lineage, classify sensitivity and populate catalogs to support GDPR and PCI DSS audits.
- Orchestration Intelligence: AI-powered schedulers—such as AWS Step Functions—predict ingestion loads and auto-scale resources.
Risk Signal Identification
- Feature Extraction Engines: Libraries derive temporal, spatial and relational attributes—transaction velocity, device fingerprint changes—to build feature vectors.
- Supervised Classification: Ensemble methods trained in Amazon SageMaker classify events into risk categories.
- Unsupervised Anomaly Detection: Isolation forests and autoencoders detect novel outliers without labeled data.
- Graph-Based Analysis: Graph neural networks uncover hidden fraud rings by modeling relationships among accounts and devices.
- Real-Time Tagging: Integrations with Apache Kafka annotate streams with risk signals at microsecond latency.
Model Training and Validation
- AutoML & Hyperparameter Tuning: Bayesian optimization and grid search via SageMaker Hyperparameter Tuning automate parameter selection.
- Experiment Tracking: MLflow logs code versions, datasets and metrics for reproducibility and audit.
- Cross-Validation & Benchmarking: Distributed k-fold validation generates stability metrics for model selection.
- Bias & Fairness Assessment: Explainable AI tools like SHAP identify feature contributions across demographics to mitigate bias.
- Governance & Model Registry: Central registries enforce access controls and approval workflows before production promotion.
Real-Time Monitoring & Anomaly Detection
- Low-Latency Inference Engines: ONNX Runtime and NVIDIA Triton optimize models for sub-millisecond predictions.
- Stream Processing with AI: Apache Flink and Spark Structured Streaming apply models on the fly using sliding windows.
- Online Feature Stores: Feast ensures consistency of features used during training and live scoring.
- Adaptive Thresholding: Bayesian change point detection dynamically adjusts alert limits.
- Observability & Alerting: AI tools monitor drift, latency and throughput, triggering retraining or scaling actions.
Automated Risk Assessment & Scoring
- Ensemble Models: Stacked decision trees, neural networks and linear learners boost predictive accuracy.
- Probabilistic Inference: Bayesian networks incorporate prior knowledge and uncertainty into scores.
- Contextual Aggregation: Attention-based models integrate temporal, spatial and relational signals.
- Dynamic Weighting: Reinforcement learning agents adjust factor weights based on incident outcomes.
- Interpretability: SHAP and LIME explain individual score contributions for transparency.
Decision Support & Recommendation Generation
- Natural Language Generation: LLMs like OpenAI GPT and IBM Watson NLU craft summaries of risk events and actions.
- Scenario Simulation: Monte Carlo models project outcomes of alternative response strategies.
- Reinforcement Learning Advisors: Policy-driven agents propose optimal remediation sequences based on reward functions.
- Knowledge Graph Querying: Graph-powered search retrieves relevant regulations, playbooks and past cases.
- Adaptive Dashboards: AI-driven visualization recommends the most relevant metrics based on user behavior.
Automated Execution & Response Orchestration
- AI Orchestrators: Platforms coordinate decision flows and invoke RPA bots.
- Robotic Process Automation: UiPath and Blue Prism automate remediation steps.
- Intelligent Routing: ML classifiers determine tasks requiring analyst review versus full automation.
- Playbook Automation: Engines select and execute predefined playbooks based on threat type and severity.
- Cross-System Integration: API gateways enforce secure communication between orchestration engines and core platforms.
Compliance Tracking & Reporting
- NLP for Narrative Generation: AI text synthesis generates regulatory narratives and summaries.
- Automated Policy Validation: Rule engines map events to controls, flagging deviations in real time.
- Document Automation: Template systems populate compliance reports with charts and tables.
- Immutable Audit Logs: Blockchain-backed or write-once storage ensures non-repudiable records.
- Regulatory Intelligence Integration: AI agents monitor updates and suggest process adjustments.
Continuous Improvement & Feedback Loop
- Drift Detection: Statistical tests and ML models monitor input and output shifts.
- Automated Retraining Pipelines: CI/CD workflows trigger retraining in response to drift alerts.
- Active Learning: Analyst-curated labels feed back into training to learn novel patterns.
- Experiment Tracking & Governance: MLflow and Kubeflow maintain versioned experiment records.
- Performance Dashboards: KPIs—precision, recall, MTTR—drive data-driven prioritization of improvements.
Variation Scenarios, Edge Cases and Exception Handling
Institution Archetypes
- Large Global Banks: Multi-tenant architectures with geo-distributed data lakes, regional inference endpoints and unified policy repositories.
- Community and Regional Banks: Managed AI services, federated learning and simplified orchestration balancing automation with analyst review.
- Investment Banks & Trading Firms: Ultra-low latency pipelines with in-memory engines, real-time fallback thresholds and circuit breakers.
- Fintech and Challenger Banks: Cloud-native APIs, transfer learning for new payment channels and human-in-the-loop gates for novel events.
- Custodial and Asset Servicing: SWIFT integration, batch and streaming connectors, multi-layer approvals and specialized reconciliation paths.
Data and Connectivity Edge Cases
- Source Outages: Buffering and replay via change data capture, heartbeat monitors and backup pipelines.
- Schema Evolution: Schema registry enforcement and AI parsers that infer and map new fields.
- Data Spikes: Autoscaling stream processors and backpressure policies to prioritize core detection.
- Poor Data Quality: Real-time validation, AI-driven missing value prediction and quality dashboards.
- Network Latency: Regionally routed inference endpoints and degraded-mode local rule execution during partitions.
Exception Handling Patterns
- Dead-Letter Queues: Quarantine invalid records for remediation microservices or manual stewardship.
- Fallback Paths: Rule-based screening maintains minimal detection during AI service outages.
- Compensating Actions: Orchestrators reverse partial failures or alert analysts to restore equilibrium.
- Graceful Degradation: Defer non-critical tasks to preserve resources for essential detection.
- Human Overrides: Analyst review with one-click override options, recorded in audit logs and feedback loops.
Regulatory and Market Adaptations
- Configurable Policy Engines: Parameterize rules per jurisdiction or business line without code changes.
- Localized Data Masks: Dynamic masking and tokenization based on locale and consent flags.
- Market-Sensitive Thresholding: Volatility-based dynamic sensitivity adjustments during stress periods.
- Vendor Normalization: Mapping configurations that unify severity scales across threat intelligence providers.
Best Practices
- Implement end-to-end monitoring with alert thresholds for lag, errors and resource use.
- Maintain schema governance via registry services and compatibility checks.
- Embed AI-driven anomaly and drift detection within pipelines.
- Design modular microservices for independent scaling and isolation of failures.
- Develop runbooks covering connector failures, model outages and data incidents.
- Foster cross-functional forums to review edge case logs and update policies.
- Use feature flags to toggle processing logic and test variations in production.
- Document variation and exception strategies in a central knowledge base.
AI Tools and Platforms
- Apache Kafka: A distributed event streaming platform used for building real-time data pipelines and streaming applications. It ensures high-throughput, low-latency handling of data streams.
- Amazon Kinesis: A fully managed service for real-time processing of streaming data at massive scale, supporting ingestion, processing, and analysis.
- Debezium: An open-source distributed platform for change data capture, enabling streaming of database changes for event-driven architectures.
- Apache NiFi AI Extensions: An extension to the Apache NiFi dataflow tool that incorporates AI-driven parsing and enrichment capabilities for automated schema inference and data quality checks.
- Snowflake: A cloud data warehouse that provides scalable storage and compute, supporting secure data sharing and high-performance analytics.
- Databricks: A unified analytics platform powered by Apache Spark that accelerates data engineering, data science, and machine learning workflows.
- AWS Glue: A managed extract, transform, and load (ETL) service that automates data preparation for analytics and machine learning.
- Apache Spark: An open-source distributed processing system for large-scale data processing and analytics, including streaming and machine learning.
- Apache Flink: A stream processing framework for scalable, high-throughput, low-latency data processing applications.
- Elastic Stack (Elasticsearch and Kibana): A suite for real-time search, observability, and visualization that powers monitoring dashboards and alert investigations.
Streaming and Event Processing Tools
- Confluent Platform: An enterprise-grade distribution of Apache Kafka, offering schema registry, connectors, and management features for streaming data pipelines.
- Azure Event Hubs: A fully managed, real-time data ingestion service for event streaming at massive scale, integrated with Azure analytics services.
- Google Pub/Sub: A globally distributed messaging service for building event-driven systems and ingesting streaming data.
- RabbitMQ: A message-broker software that supports multiple messaging protocols for event distribution and task queuing.
Machine Learning Frameworks and MLOps Platforms
- Amazon SageMaker: A fully managed service for building, training, and deploying machine learning models at scale, with built-in hyperparameter tuning and model monitoring.
- MLflow: An open-source platform for managing the end-to-end machine learning lifecycle, including experiment tracking, model registry, and deployment.
- Kubeflow: A Kubernetes-native platform for orchestrating machine learning pipelines and managing model training and serving at scale.
- TensorFlow: An open-source deep learning framework for building and deploying machine learning models across a variety of platforms.
- PyTorch: A flexible deep learning framework emphasizing dynamic computation graphs and rapid research prototyping.
- ONNX Runtime: A high-performance inference engine for models in the Open Neural Network Exchange (ONNX) format, supporting CPU and GPU acceleration.
- NVIDIA Triton Inference Server: A multi-framework inference server providing optimized performance and scalability for deep learning models on GPUs.
- Azure Machine Learning: A cloud service for end-to-end machine learning operations, including automated ML, model registry, and MLOps integration.
Orchestration and Workflow Automation Tools
- Apache Airflow: A platform to programmatically author, schedule, and monitor workflows as directed acyclic graphs of tasks.
- Prefect: A modern workflow orchestration framework that combines dynamic scheduling with built-in observability and failure handling.
- Kubeflow Pipelines: A Kubernetes-based workflow engine for building and deploying portable, scalable ML workflows.
- Jenkins: An open-source automation server for continuous integration and continuous deployment pipelines.
- GitLab CI/CD: A built-in CI/CD system in GitLab that automates builds, testing, and deployment.
- Camunda: A workflow and decision automation platform for orchestrating business processes and microservices.
- UiPath: A robotic process automation (RPA) platform for automating repetitive manual tasks across enterprise applications.
Natural Language Processing and NLG Engines
- OpenAI GPT: A family of large language models capable of generating human-like text for narrative synthesis and interactive agents.
- IBM Watson Natural Language Understanding: An NLP service that extracts entities, sentiment, and key concepts from text to support enrichment and report generation.
- IBM Watson Orchestrate: An AI assistant platform that automates workflows and tasks via conversational interfaces and prebuilt skills.
Monitoring, Visualization, and Alerting Solutions
- Splunk: A platform for searching, monitoring, and analyzing machine-generated data, widely used in security information and event management (SIEM).
- Grafana: An open-source analytics and interactive visualization web application for real-time monitoring of metrics and logs.
- Microsoft Power BI: A business analytics tool that provides interactive visualizations and real-time dashboards for decision support.
- Tableau: A visual analytics platform that transforms data into interactive, shareable dashboards for business insights.
- PagerDuty: A digital operations management platform for alerting and on-call scheduling, ensuring timely incident response.
Infrastructure and Container Orchestration
- Kubernetes: An open-source system for automating deployment, scaling, and management of containerized applications.
- Docker: A platform for building, shipping, and running applications in containers to ensure consistency across environments.
- Istio: A service mesh that provides traffic management, security, and observability for microservices.
Compliance and GRC Platforms
- ServiceNow GRC: A governance, risk, and compliance solution for managing policy, risk assessments, and audit workflows.
- MetricStream: A platform for integrated risk management, compliance, and audit management across regulated industries.
- RSA Archer: A comprehensive risk management platform for enterprise policy and compliance automation.
- Collibra: A data governance platform that enables data cataloging, stewardship, and compliance with data policies.
Additional Context and Resources
- Basel III Framework: International banking regulations establishing capital requirements and risk management standards.
- General Data Protection Regulation (GDPR): European Union regulation governing data protection and privacy for individuals.
- ISO 20022: A global standard for financial messaging that supports consistent transaction data exchange and reporting.
- MITRE ATT&CK Framework: A globally accessible knowledge base of adversary tactics and techniques based on real-world observations.
- OpenC2: An open standard language for command and control of cyber defense components.
The AugVation family of websites helps entrepreneurs, professionals, and teams apply AI in practical, real-world ways—through curated tools, proven workflows, and implementation-focused education. Explore the ecosystem below to find the right platform for your goals.
Ecosystem Directory
AugVation — The central hub for AI-enhanced digital products, guides, templates, and implementation toolkits.
Resource Link AI — A curated directory of AI tools, solution workflows, reviews, and practical learning resources.
Agent Link AI — AI agents and intelligent automation: orchestrated workflows, agent frameworks, and operational efficiency systems.
Business Link AI — AI for business strategy and operations: frameworks, use cases, and adoption guidance for leaders.
Content Link AI — AI-powered content creation and SEO: writing, publishing, multimedia, and scalable distribution workflows.
Design Link AI — AI for design and branding: creative tools, visual workflows, UX/UI acceleration, and design automation.
Developer Link AI — AI for builders: dev tools, APIs, frameworks, deployment strategies, and integration best practices.
Marketing Link AI — AI-driven marketing: automation, personalization, analytics, ad optimization, and performance growth.
Productivity Link AI — AI productivity systems: task efficiency, collaboration, knowledge workflows, and smarter daily execution.
Sales Link AI — AI for sales: lead generation, sales intelligence, conversation insights, CRM enhancement, and revenue optimization.
Want the fastest path? Start at AugVation to access the latest resources, then explore the rest of the ecosystem from there.